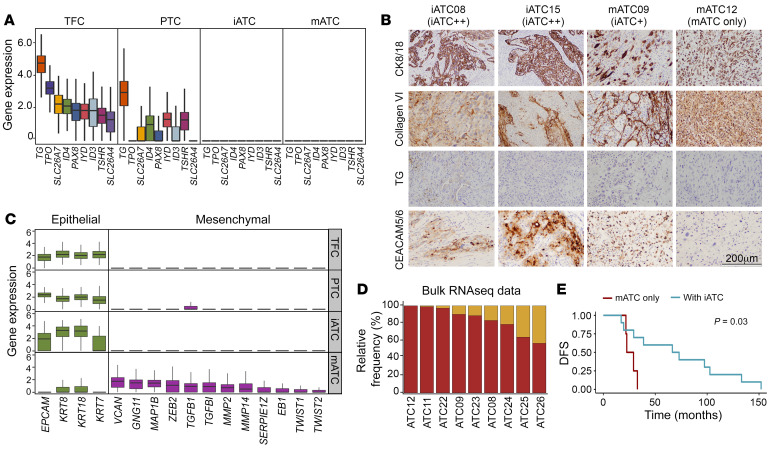
Figure 3. Characteristics of epithelial cell subtypes in thyroid cancer.
(A) Box plot of thyroid function gene expression. (B) IHC staining of protein markers in 4 ATC samples. Scale bar: 200 μm. (C) Box plots of epithelial (green) and mesenchymal (purple) marker gene expression. (D) Stacked bar plot of relative fractions of 2 ATC subtypes. (E) Kaplan-Meier plot of disease-free survival (DFS) of 14 patients with ATC. P values were determined by 2-sided log-rank test. All boxes are centered at the median and bounded by the first (Q1) and third (Q3) quartiles. Upper whiskers show the minimum (maximum, Q3 + 1.5 IQR), and lower whiskers show the maximum (minimum, Q1 – 1.5 IQR).

