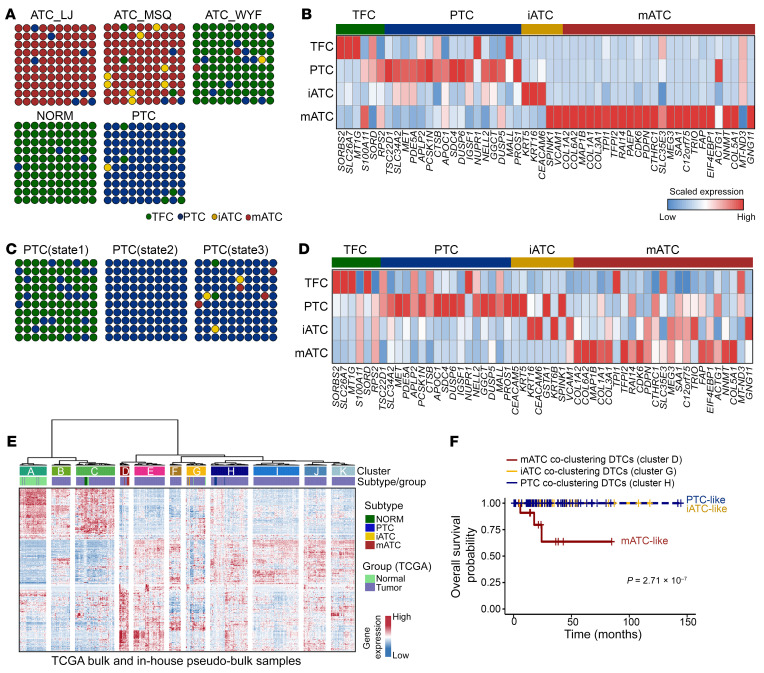
Figure 4. Activation of iATC and mATC signatures in thyroid cancer.
(A and C) Dot plots depict the predicted cell subtype compositions. Normal, PTC, and PTC states are combinations of all cells in each sample type. ATC plots are for individual patients. Data in A are from Luo et al. (29), and data in C are from Pu et al. (30). (B and D) Heatmaps showing scaled expression levels of the 59-gene signature with detection in 2 published data sets. (E) Coclustering of TCGA bulk RNA-Seq data from Nishant et al. (23), with in-house pseudobulk analysis of scRNA-Seq data based on a union of TFC and tumor-specific genes (Supplemental Table 3). (F) Kaplan-Meier plot of overall survival of DTC patients with partial activation of ATC and PTC phenotypes. P values were determined by 2-sided log-rank test. +, censored observations.

