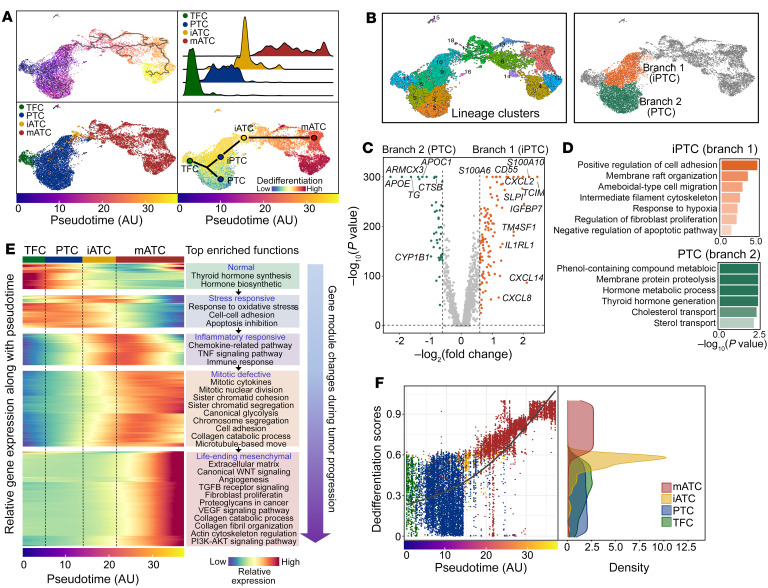
Figure 5. Single-cell transcriptional trajectory during anaplastic transformation in thyroid cancer.
(A) UMAP projections of single epithelial cells along inferred trajectory by monocle3. Cells are colored by pseudotime (top left), epithelial cell subtypes (bottom left), and dedifferentiation scores inferred by CytoTRACE (bottom right). Top right: Ridge plot of densities of epithelial cell numbers over pseudotime. (B) Identification of 2 PTC branches through clustering and trajectory lineages. (C) Differential gene expression between 2 PTC branches. P values were determined by Wilcoxon test. (D) Gene set enrichment comparisons between 2 PTC branches. (E) Heatmap of the expression of genes with significant temporal changes. (F) Scatterplot of epithelial cells. Right panel shows a density plot of the dedifferentiation scores. AU, artificial unit of pseudotime.

