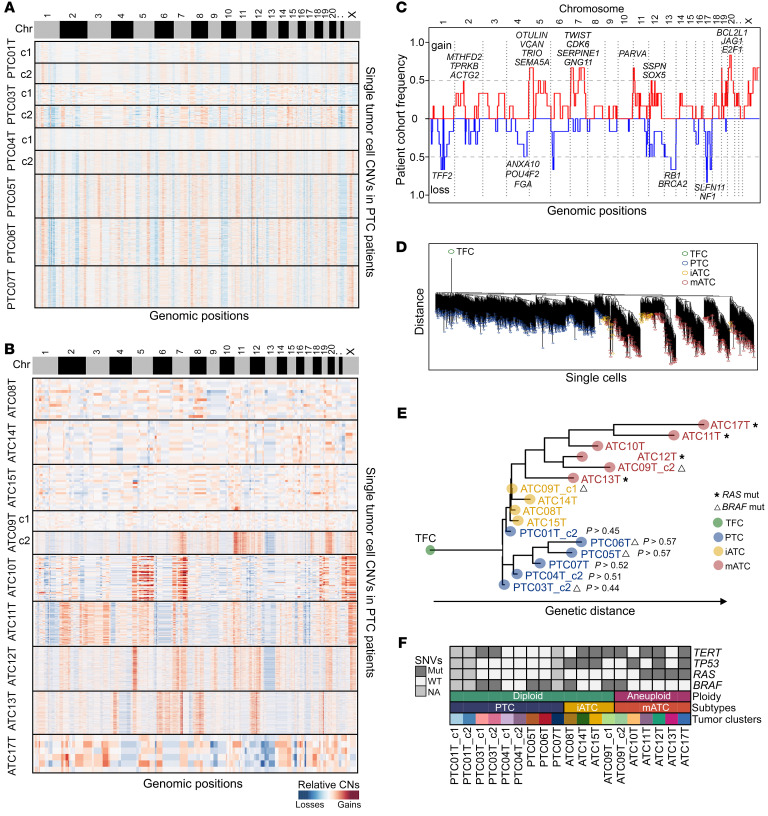
Figure 7. Single-cell CNA and point mutation during thyroid cancer cell progression.
(A and B) Heatmaps of relative copy number ratios of PTC (A) and ATC (B) tumor cells inferred by CopyKAT. (C) Frequency plot of CNAs across patients with mATC. (D) N-J tree of single tumor cells with inferred single-cell copy number data. (E) M-P tree of tumors cells, rooted to an artificial normal TFC. P values were estimated from 1,000 iterations of bootstrap resampling. (F) Paneled single nucleotide variants (SNVs) and aneuploidy of epithelial cell clusters for all patients. Mut, mutation.

