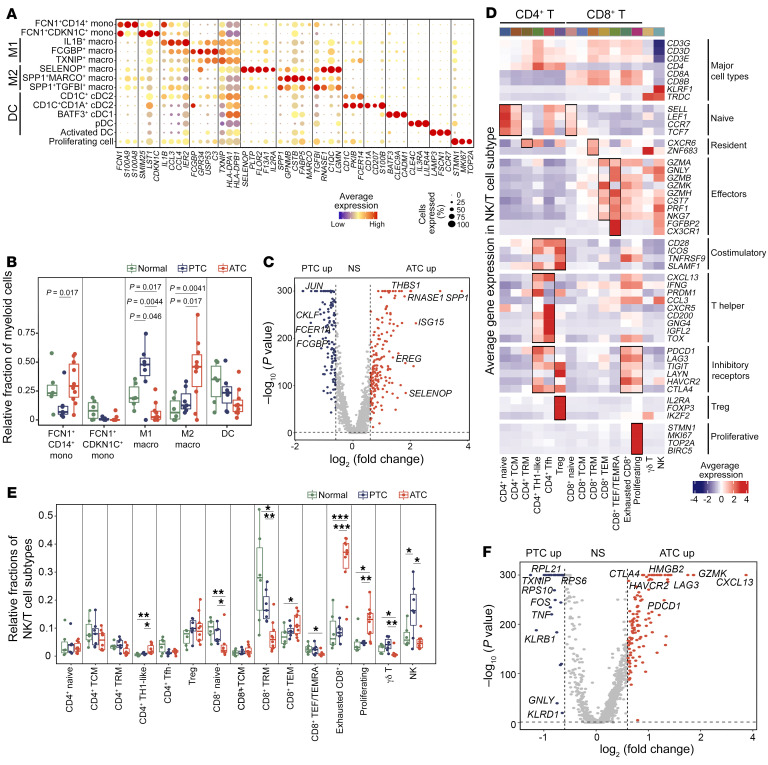
Figure 8. Remodeling of the tumor immune microenvironment during thyroid cancer progression.
(A) Bubble heatmap of selected marker genes in myeloid cell subpopulations. (B) Box plot of relative fractions of major myeloid cell subtypes. P values were determined by 2-sided, unpaired Student’s t test. (C) Volcano plot of differential gene expression analysis of PTC- and ATC-derived macrophages after SoupX. P values were determined by Wilcoxon test. up, upregulated. (D) Heatmap of gene expression z scores for selected marker genes of identified T and NK cell subpopulations. (E) Box plot of the relative frequencies of T and NK cell subpopulations. ***P < 0.001, **P < 0.01, and *P < 0.05, by 2-sided, unpaired Student’s t test. (F) Volcano plot of differential gene expression analysis of PTC- and ATC-derived T and NK cells. P values were determined by Wilcoxon test. NS: P > 0.05 or log2(fold change) <0.6. Macro, macrophages; Mono, monocytes.

