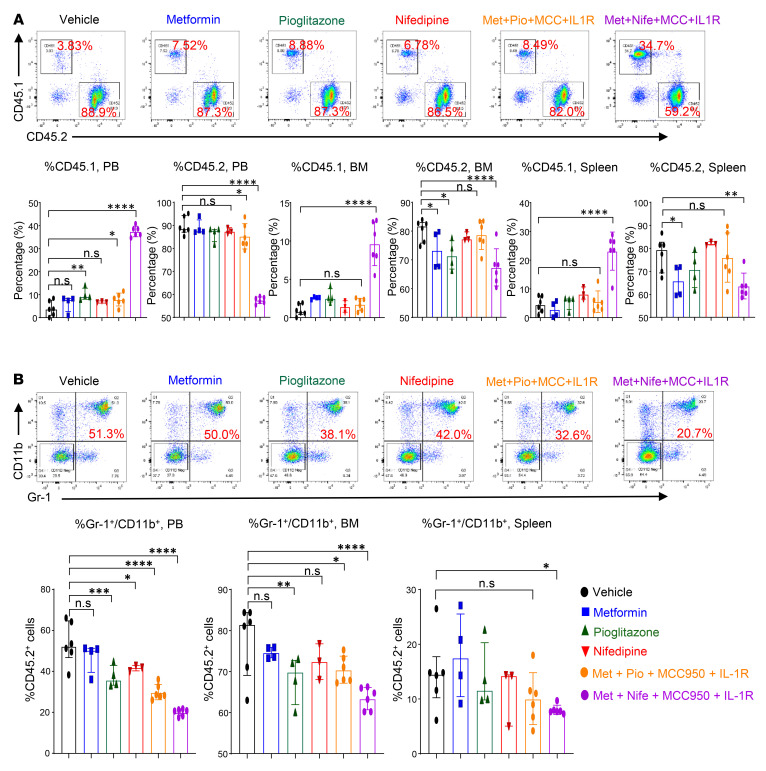
Figure 10. Effect of metformin, nifedipine, MCC950, and anakinra treatment on Tet2-deficient myeloid cells.
(A) Representative flow cytometry plots of donor chimerism (CD45.1+/CD45.2+) in the PB of recipient mice after 30 days of the indicated drug treatment and quantification of CD45.1+ cells in the PB, CD45.2+ cells in the PB, CD45.1+ cells in the BM, CD45.2+ cells in the BM, CD45.1+ cells in the spleen, and CD45.2+ cells in the spleen after 30 days of the indicated drug treatment. (B) Representative flow cytometry profile of myeloid cells (Gr-1+CD11b+) in the PB of recipient mice after 30 days of the indicated drug treatment and quantification of Gr-1+CD11b+ double-positive cells in the PB, BM, and spleen after 30 days of the indicated drug treatment (n = 3–6 mice per group). Data are shown as the mean ± SEM. *P < 0.05, **P < 0.005, ***P < 0.0005, and ****P < 0.0001, by 1-way ANOVA.

