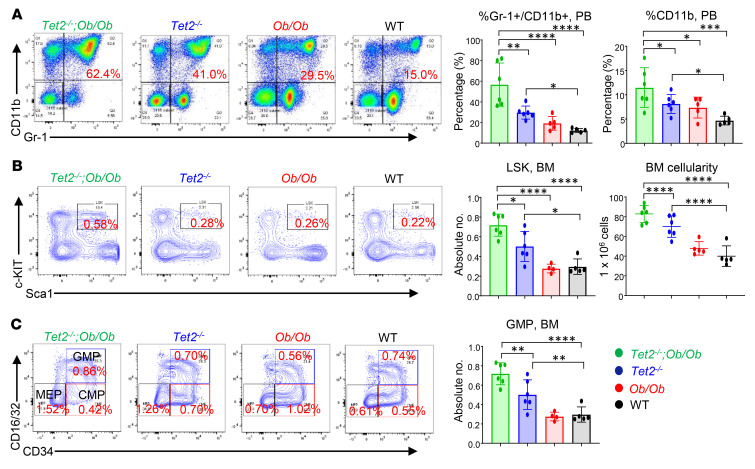
Figure 3. Obesity exacerbates the expansion of Tet2–/– pre-LHSCs/PCs.
(A) Representative flow cytometry plots of PB mature myeloid cells (Gr-1+CD11b+) from mice of the indicated genotypes. An increased frequency of myeloid cells (Gr-1+CD11b+) and CD11b+ cells was observed in Tet2–/– Ob/Ob compound mutant mice compared with mice in the other groups. (B) Representative flow cytometry plots of BM LSK cells from mice of the indicated genotypes. Enhanced absolute numbers of total LSK cells and BM cellularity were observed in Tet2–/– Ob/Ob mice compared with mice in the other groups. (C) Representative flow cytometry plots of BM progenitors from mice of the indicated genotypes. Enhanced absolute numbers of total GMPs (Lin−c-KIT+CD16/CD32+CD34+) were observed in Tet2–/– Ob/Ob mice compared with mice in the other groups (n = 5–6 mice per group). Data are shown as the mean ± SEM. *P < 0.05, **P < 0.005, ***P < 0.0005, and ****P < 0.0001, by 1-way ANOVA.

