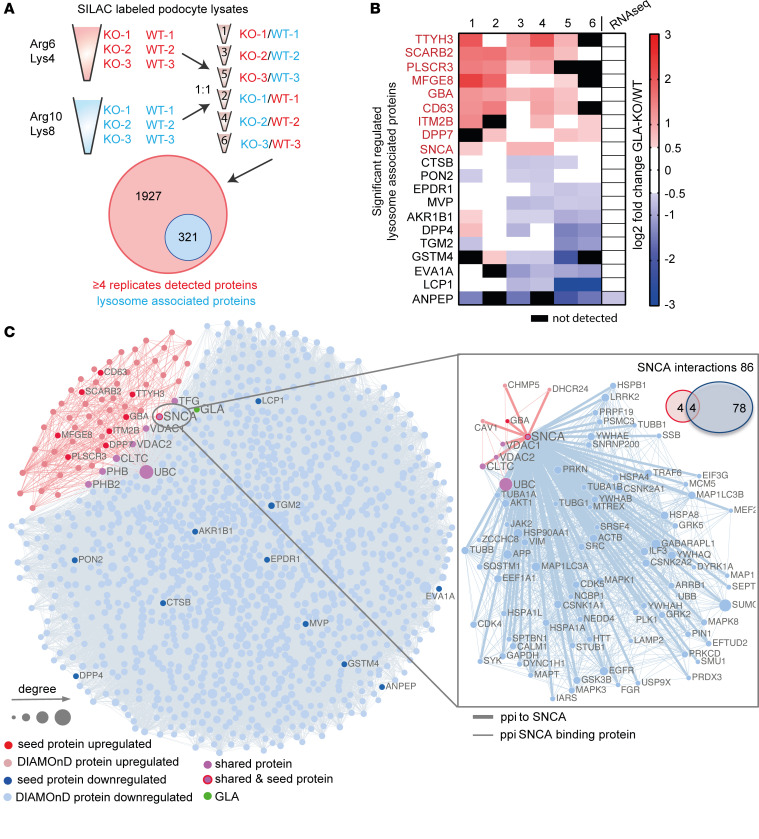
Figure 2. SILAC-based proteomics and network analyses identify SNCA accumulation as a potential pathogenic pathway.
(A) Schematic overview of mass spectrometry analysis using SILAC-labeled WT and KO clones. Mass spectrometry yielded 2,248 proteins, among which 321 are lysosome-enriched. (B) The top 10 up- and downregulated lysosome-enriched proteins. (C) Network-based analysis of up- and downregulated lysosomal proteins associated with GLA knockout. Nodes represent genes and are connected if there is a known protein interaction between them. The node size is proportional to the number of its connections. Red and blue nodes represent up- and downregulated seed proteins, respectively. Light red and light blue nodes represent the respective DIAMOnD proteins. GLA is depicted as a green node. Pink nodes indicate shared proteins between the 2 modules. The separate network and Venn diagram on the right show the number and interaction partners of SNCA.

