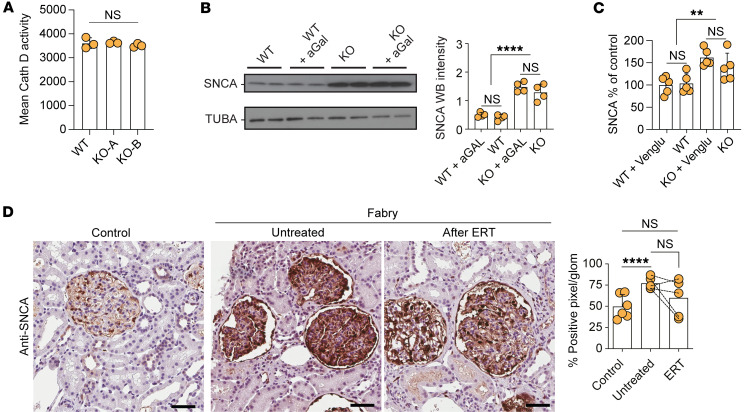
Figure 3. SNCA accumulation is resistant to enzyme replacement and substrate reduction therapy.
(A) Mean cathepsin D activity in WT cells and 2 KO clones showing no differences in enzyme activity (n = 3). (B) Western blots of SNCA and TUBA in vehicle- and aGAL-treated WT and KO cells with quantification confirming the overexpression of SNCA protein and its resistance to aGAL treatment (n = 4). (C) Human SNCA ELISA depicting SNCA accumulation in KO clones and resistance to substrate reduction therapy using Venglustat (n = 5). (D) SNCA staining in representative images and quantification of human renal biopsies showing increase in untreated Fabry samples with resistant accumulation in patients who underwent 5 years of ERT (n = 5). Scale bars: 50 μm. **P < 0.01, ****P < 0.0001. One-way ANOVA with Tukey’s multiple-comparison test.

