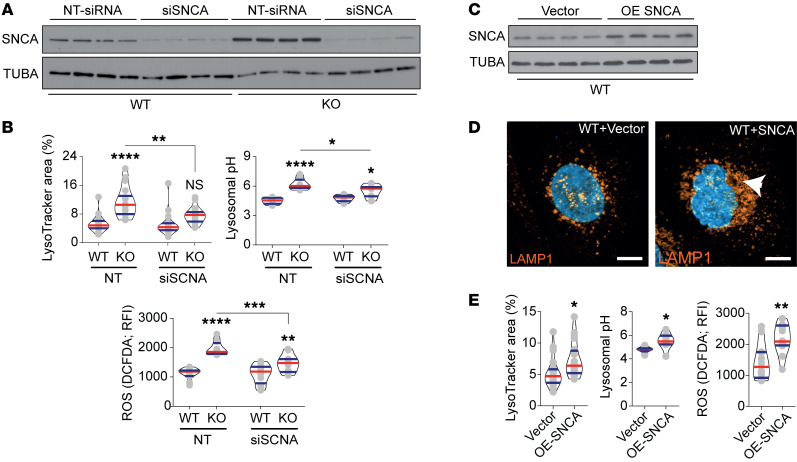
Figure 4. SNCA mediates observed lysosomal dysfunction.
(A) Representative Western blot confirming the efficacy of siRNA targeting SNCA in WT and KO clones (n = 4). (B) Quantification of lysosomal area, pH, and ROS production upon SNCA siRNA treatment (n = 18). (C) Representative Western blot confirming the overexpression of SNCA in WT cells (n = 4). (D) LAMP1 immunofluorescence staining shows an increase in lysosomal aggregation upon SNCA overexpression (arrowhead). Scale bars: 10 μm. (E) Quantification of lysosomal area (n = 20), pH (n = 8), and ROS production (n = 12) upon SNCA overexpression. Violin plots indicate median (red) and upper and lower quartile (blue). *P < 0.05, **P < 0.01, ***P < 0.001, ****P <0.0001. One-way ANOVA with Tukey’s multiple-comparison test (B); unpaired, 2-tailed Student’s t test (E).

