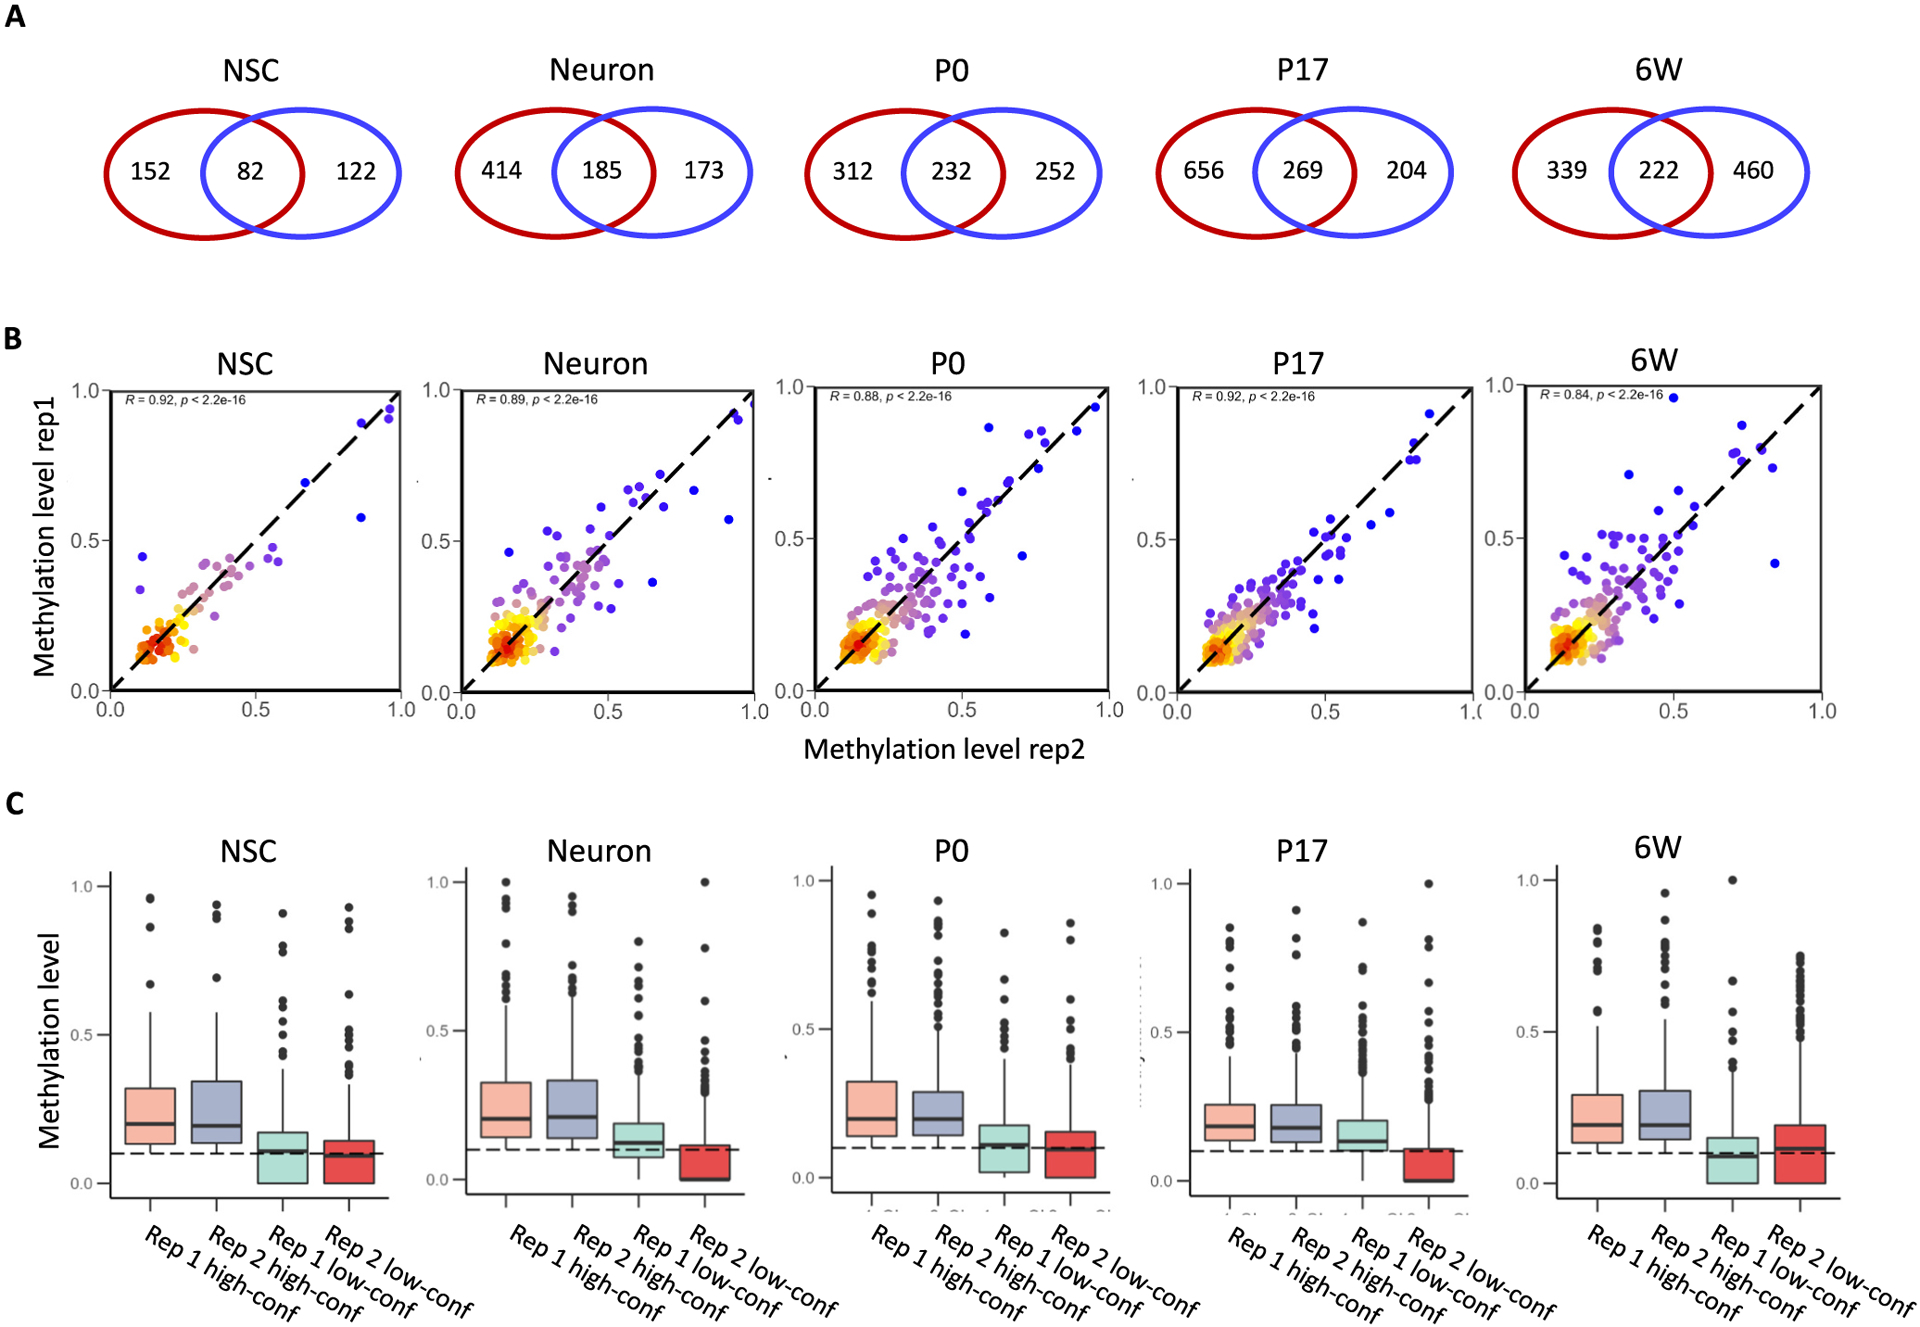
Fig. 2.

Reproducibility of replicates among RNA BS-seq samples. (A) Overlap of m5C sites identified between biological replicates. The red circle indicates replicate 1 and the blue circle indicates replicate 2. (B) Methylation correlation (Spearman’s R) of the overlapping m5C sites between biological replicates. Color code indicates the density of sites, ranging from red (high density) to blue (low density). (C) Distribution of methylation levels for the overlapping and non-overlapping m5C sites identified between biological replicates.
