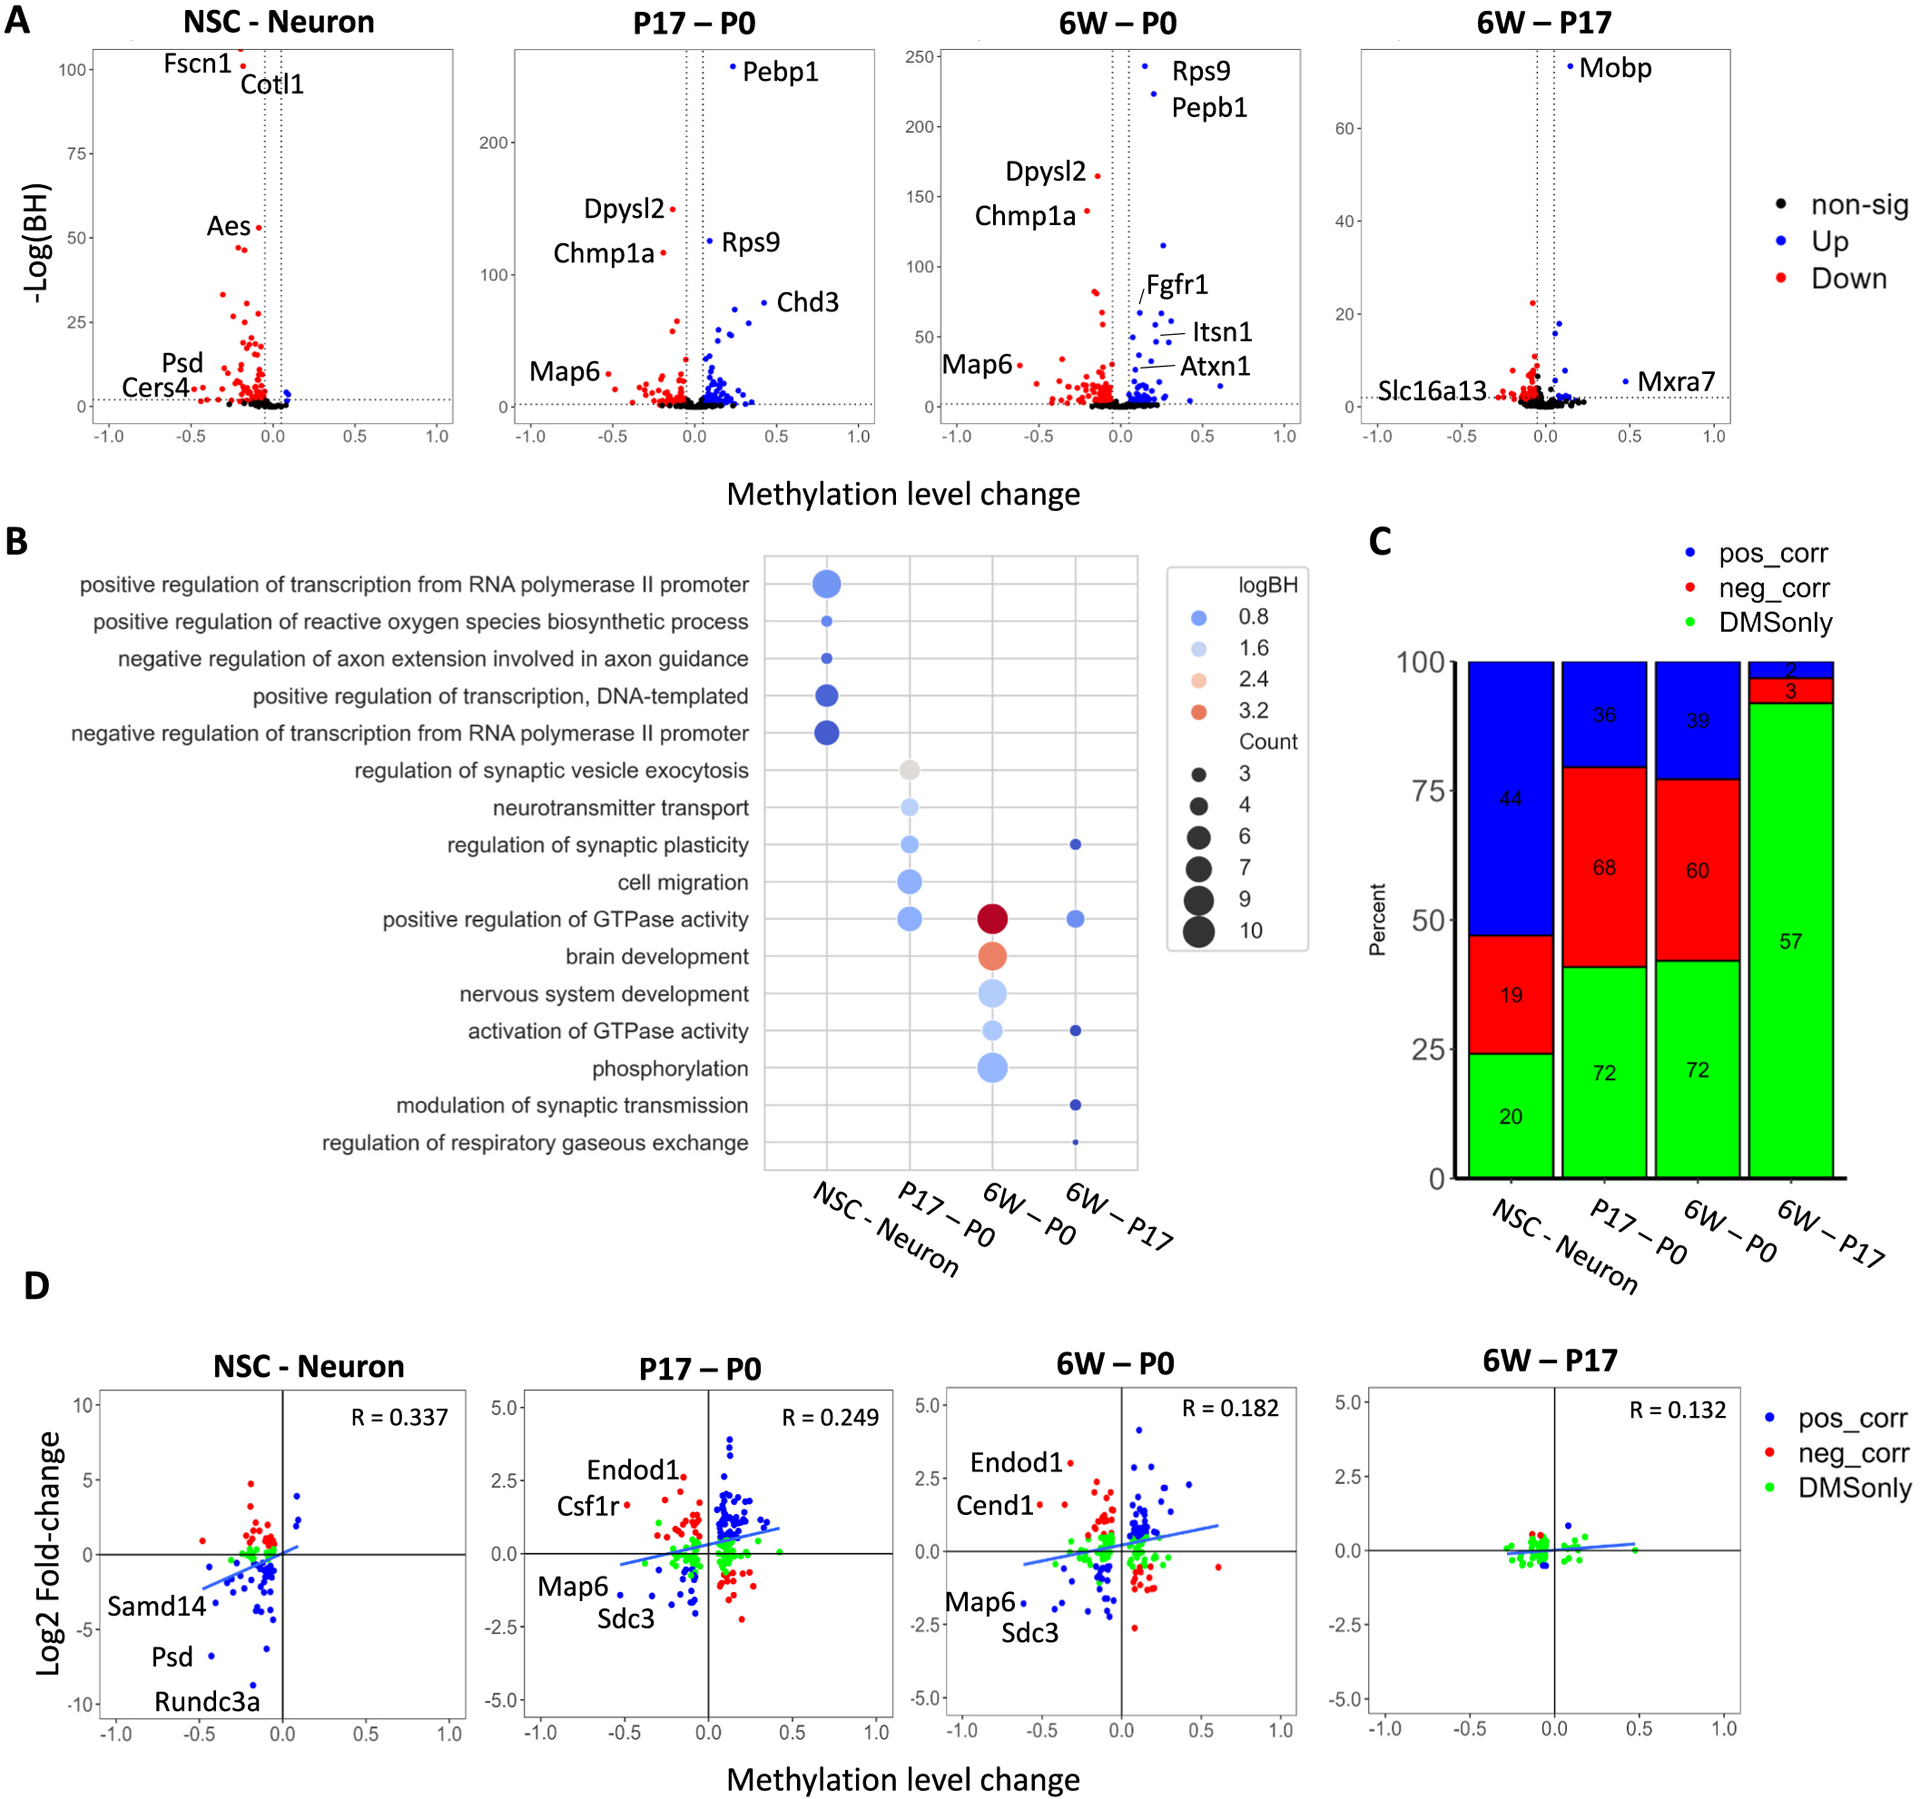
Fig. 4.

Methylation dynamics throughout brain development. (A) Differential methylation analysis of neuron and brain samples. Blue and red points represent significantly hyper and hypo methylated transcripts, respectively. Significance was determined using Fisher exact test followed by Benjamini-Hochberg correction for multiple comparison (p < 0.05), requiring a minimum difference of 0.05 in methylation. (B) Gene Ontology analysis of differentially methylated transcripts identified in (A). (C) Correlation analysis of changes in RNA expression and methylation for transcripts carrying differentially methylated sites. Blue and red bars represent positive and negative correlation between methylation level difference and expression fold-change, respectively. Green bars represent transcripts without expression fold-changes above 2 and p-adjusted <0.01. (D) Dot plot representation of transcripts to indicate the changes in methylation and expression. Overall correlation was determined using Spearman’s R. Transcripts with methylation difference over 0.3 are notated.
