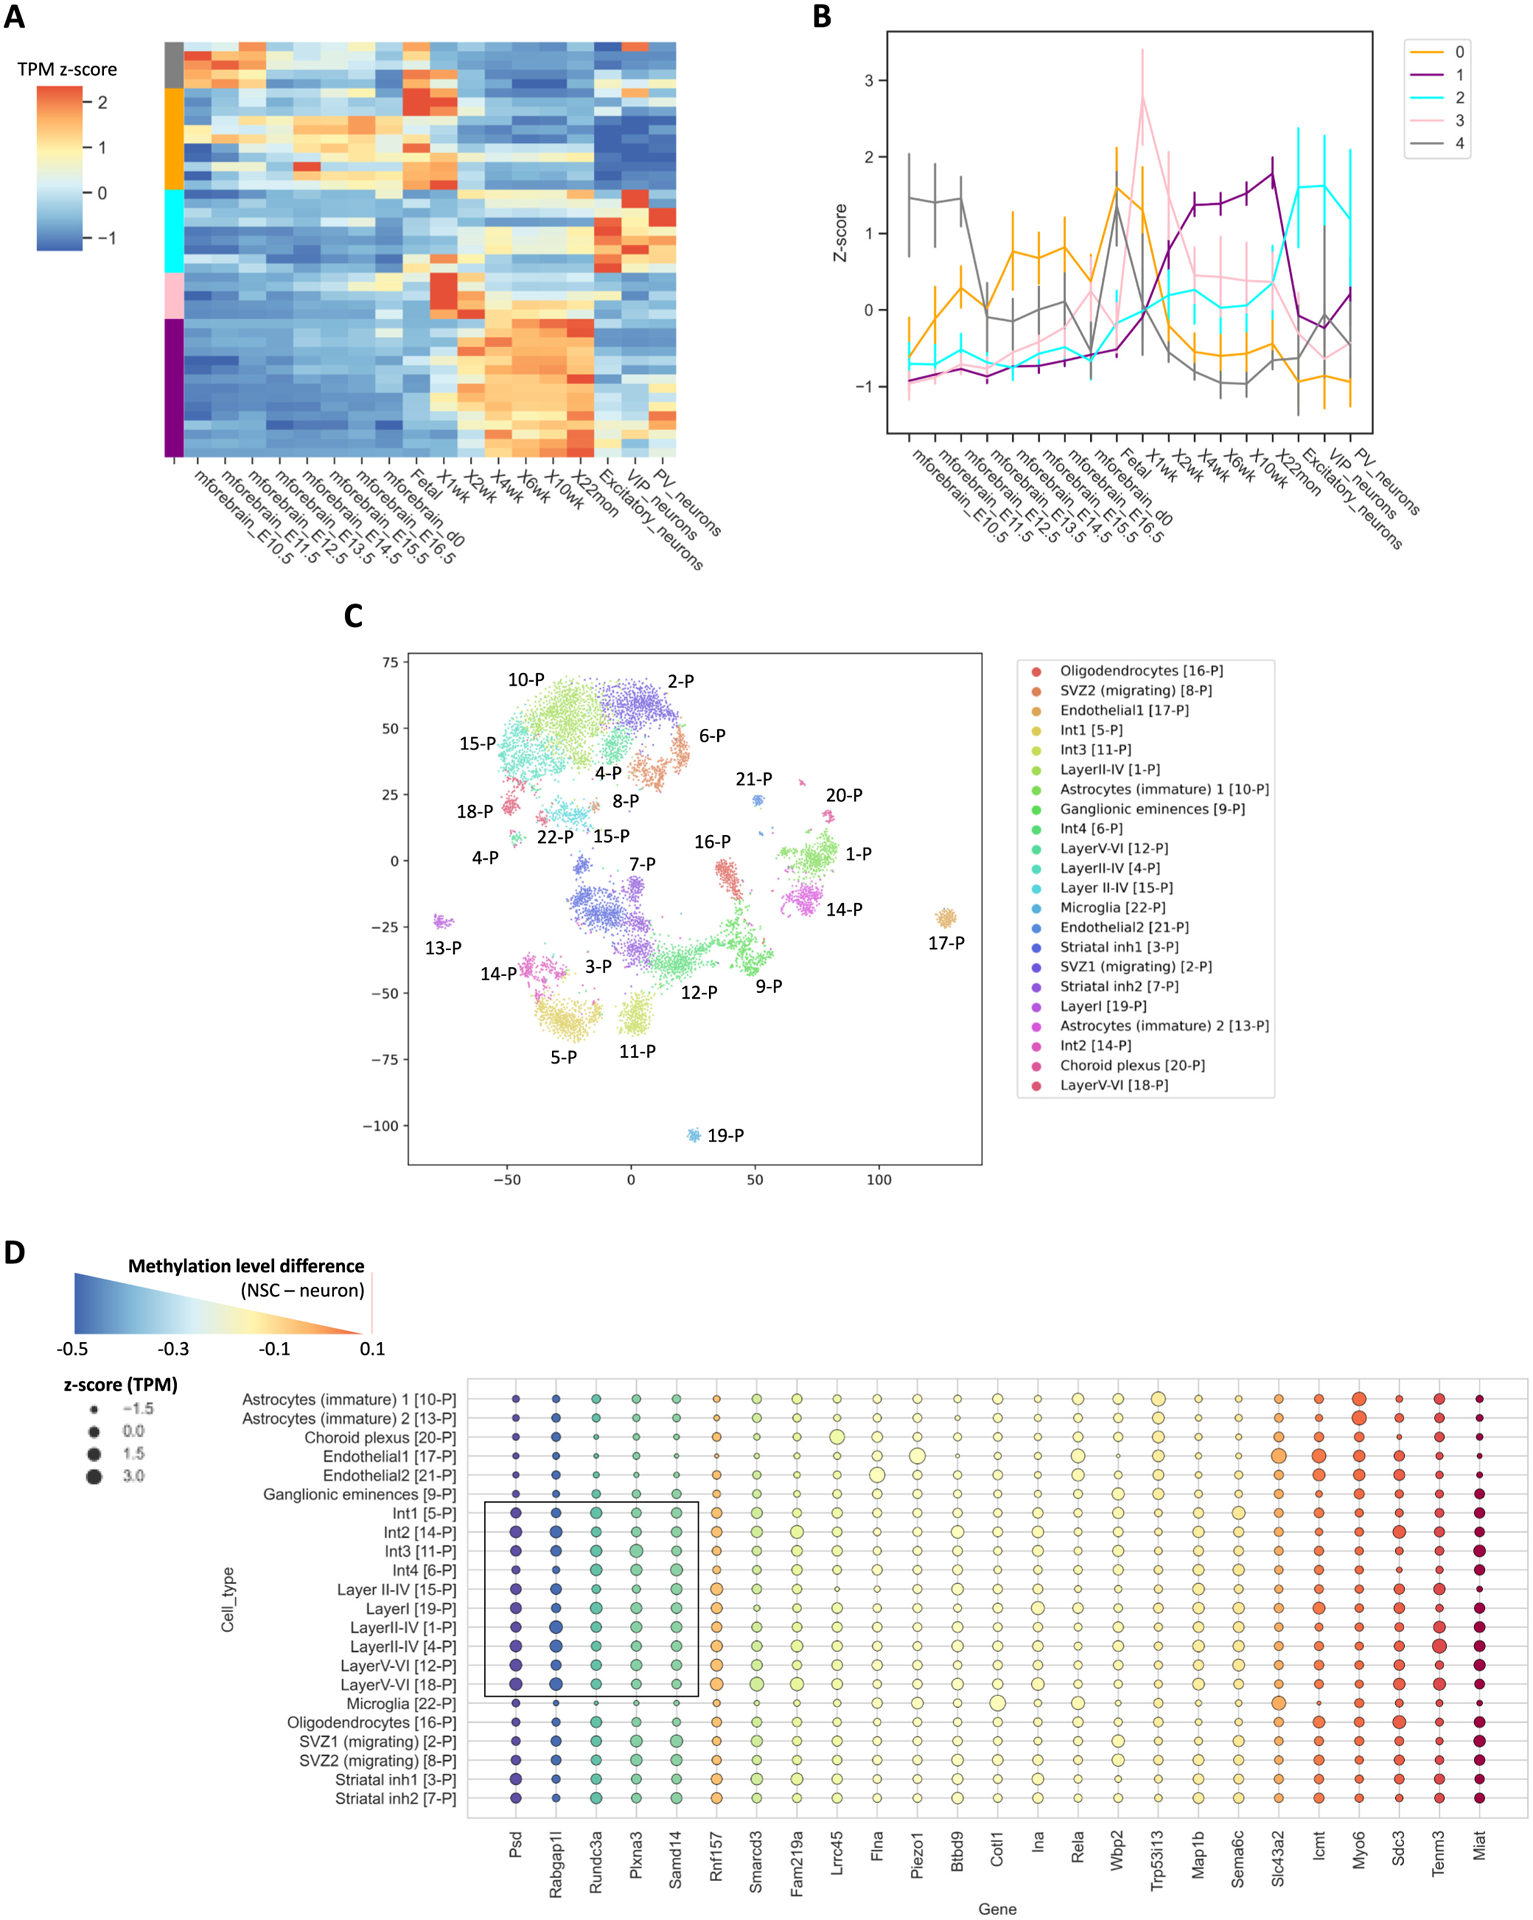
Fig. 6.

Temporal and spatial expression of differentially methylated transcripts. (A) Clustering analysis of expression profiles for differentially methylated transcripts. Z-score of TPM was used to perform clustering. (B) Linear representation of clusters identified in (A). Error bars represent standard deviation. (A) and (B) share the same color code. (C) tSNE clustering of scRNAseq P0 brain tissue from Loo et al., 2019 [22]. p is denoted as postnatal. (D) TPM z-score of differentially methylated transcripts using scRNA-seq data generated for P0 brain. Color of bubble plot indicates methylation level differences between NSC and neuron RNA BS-seq samples.
