Figure 2.
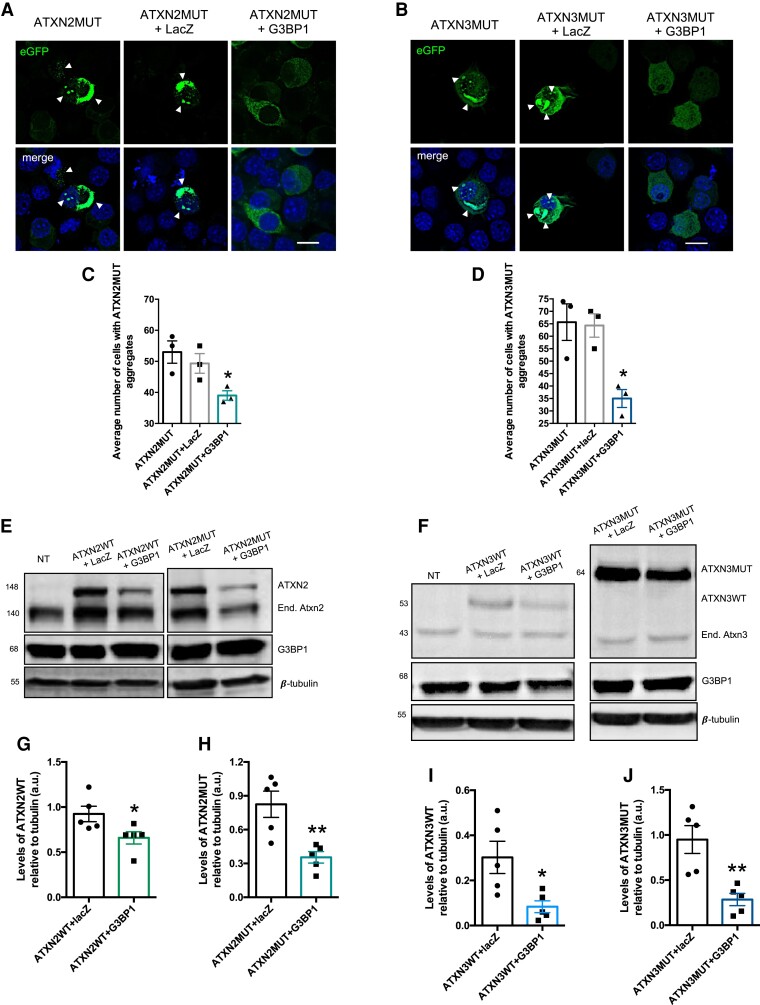
The expression of G3BP1 reduces the number of cells with aggregates of ATXN2MUT and ATXN3MUT. (A) Confocal microscopy representative images depicting Neuroa2 cells expressing ATX2MUT in three different experimental conditions. (B) Confocal microscopy representative images depicting Neuroa2 cells expressing ATX3MUT in three different experimental conditions. (C) The number of cells with aggregates of ATX2MUT per 100 transfected cells was significantly reduced on G3BP1 expression, compared to both control conditions. (D) The number of cells with aggregates of ATX3MUT per 100 transfected cells was significantly reduced on G3BP1 expression, compared to both control conditions (n = 3 independent experiments; *P < 0.05; one-way ANOVA followed by post hoc Bonferroni multiple comparisons test). Values are expressed as mean ± SEM. Scale bar = 10 µm. (E) Representative western blot of Neuro2a lysates expressing pathological and non-pathological forms of ATXN2, co-transfected with lacZ or with G3BP1. Western blots were labelled using ATXN2, G3BP1 and β-tubulin
antibodies. (F) Representative western blot of Neuro2a lysates expressing pathological and non-pathological forms of ATXN3, co-transfected with lacZ or with G3BP1. Western blots were labelled using ATXN3, G3BP1 and β-tubulin
antibodies. (G) The levels of ATXN2WT protein are significantly reduced on G3BP1 expression, compared with control cells co-expressing lacZ. (H) The levels of ATXN2MUT protein are significantly reduced on G3BP1 expression, compared with control cells co-expressing lacZ. (I) The levels of ATXN3WT protein are significantly reduced on G3BP1 expression, compared with control cells co-expressing lacZ. (J) The levels of ATXN3MUT protein are significantly reduced on G3BP1 expression, compared with control cells co-expressing lacZ (n = 5 independent experiments; *P < 0.05; **P < 0.01; Student’s t-test).

