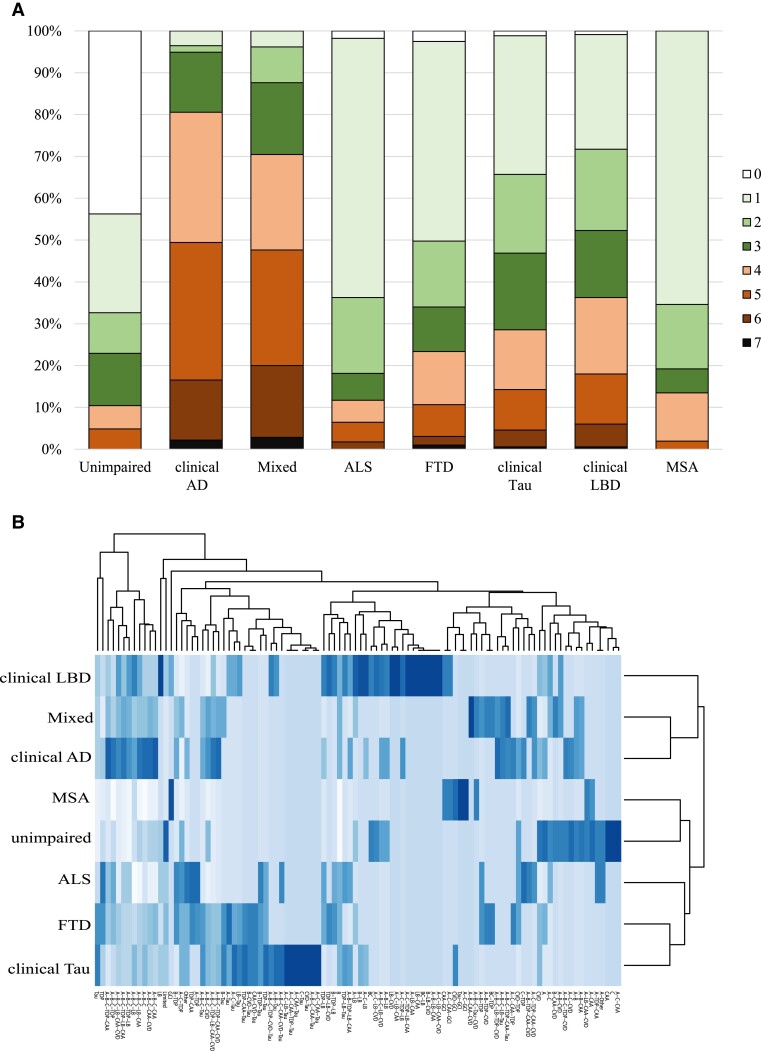
Figure 2.
Prevalence of total number of pathologies and specific pathological combinations by clinical group. The total number of pathologies and the specific pathological combinations were variably distributed in each clinical group. (A) The presence of one or more pathologies was not uncommon in the unimpaired group and most cases in the clinical Alzheimer’s disease (AD) group had four or more pathologies. Between these two extremes, the prevalence of multiple pathologies was common in each ND group. (B) One hundred and sixty-one pathological combinations were observed across the cohort with 10 combinations accounting for approximately half of each clinical group. Consequently, the incidence of the remaining 151 combinations ranged from uncommon to rare, with 61 combinations only observed in individuals. The clinical LBD group was the most heterogeneous, the MSA group was the most homogeneous and 35 combinations were observed in the unimpaired group. Shown is a heat map showing the prevalence of the top 100 non-unique combinations after cubed-root transformation, generated using the heatmap function in R Version 4.2.1.

