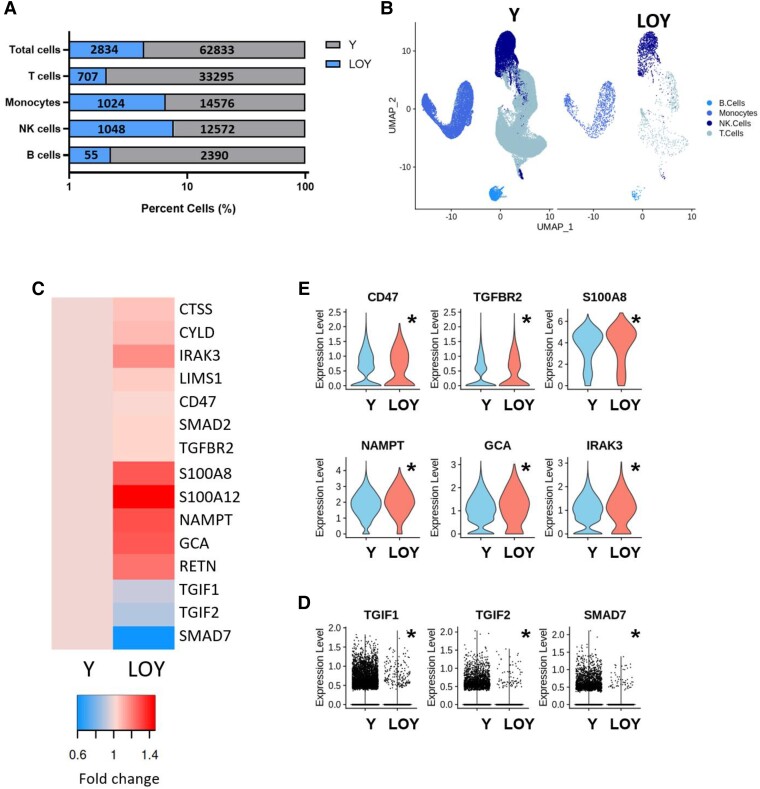
Figure 3.
Single cell RNA sequencing analysis of LOY cell type distribution and gene signatures in patient-derived monocytes (pooled data from seven patients). (A) Percent of LOY and Y chromosome harboring cells by immune cell class with absolute cell counts labelled within bars. (B) UMAP of monocytes harboring Y chromosome and LOY monocytes. (C) Heatmap of the expression of regulated genes associated with fibrosis and TGFβ signaling within the monocyte population. (D) Expression of down-regulated genes in individual monocytes associated with TGFβ inhibition. (E) Violin plots of expression of up-regulated genes associated with fibrosis and TGFβ signaling within the monocyte population. Significant comparisons were performed using the Wilcoxon Rank Sum test followed by Bonferroni correction. Significance was reported if adjusted P < 0.05 and indicated with asterisk (*).

