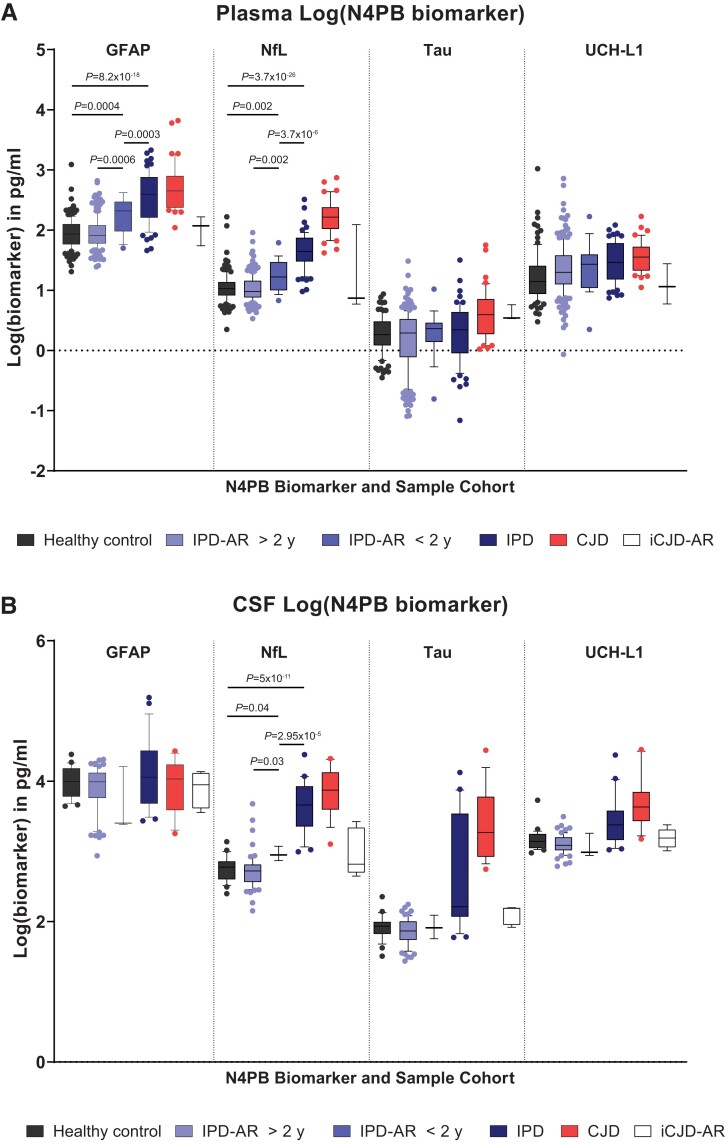
Figure 4.
Simoa N4PB measurements in prion disease and at-risk cohorts. (A) Plasma N4PB levels, where only GFAP and NfL showed statistically significant different mean values between IPD at-risk and disease groups. (B) CSF N4PB levels, where only NfL showed statistically significant different mean values between IPD at-risk and disease groups.

