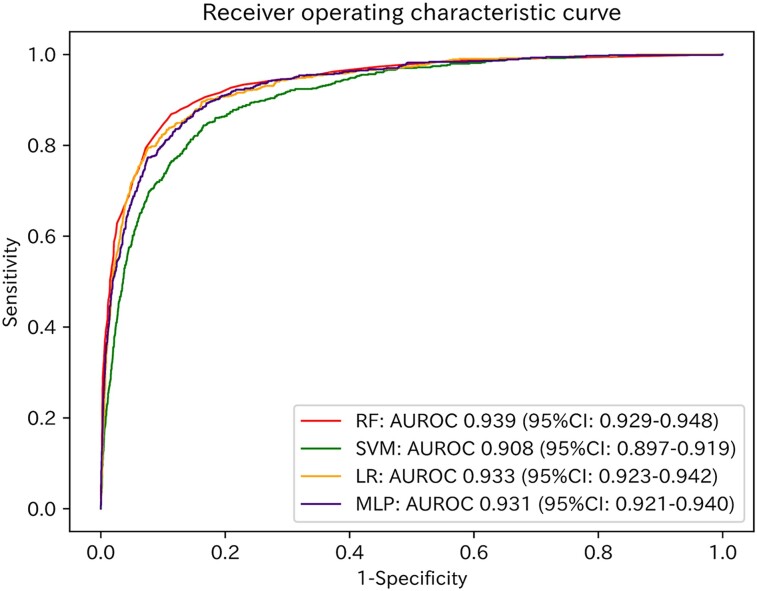
Figure 2.
Receiver operating characteristic curves of the four models applied to the test dataset. Red, green, orange, and purple lines represent the receiver operating characteristic curves of the random forest model, support vector machine model, logistic regression model, and multi-layer perceptron model, respectively. RF, random forest model; SVM, support vector machine model; LR, logistic regression model; MLP, multi-layer perceptron model; AUROC, area under the receiver operating characteristic curve; CI, confidence interval.

