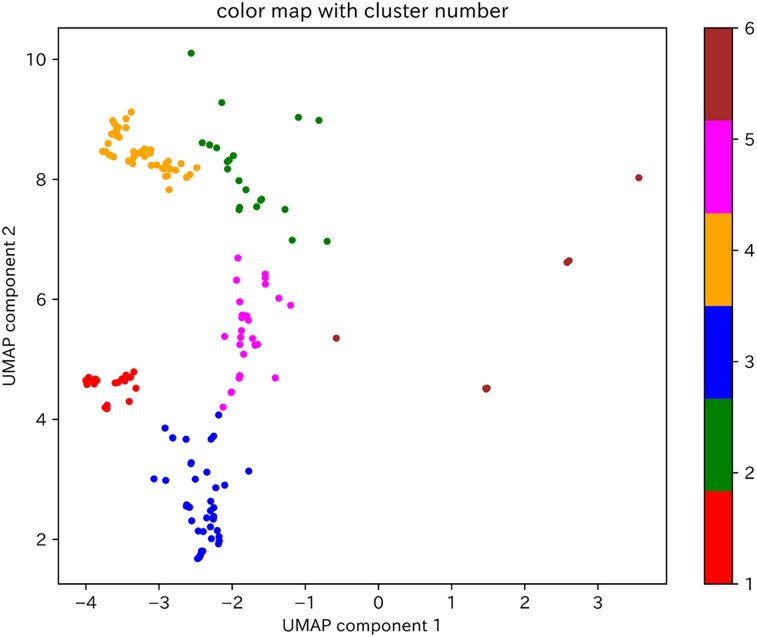
Figure 4.
Clustering of two-dimensional SHAP values for ECGs in the test dataset by which the model predicted reduced LVEF. The 192 ECGs by which the model predicted reduced LVEF, excluding those with a paced rhythm, were clustered by adapting a variational Bayesian Gaussian mixture model to the two-dimensional SHAP values. The clusters are classified from 1 to 6, and the data points belonging to each cluster are coloured red, green, blue, orange, pink, or brown. UMAP, uniform manifold approximation and projection.

