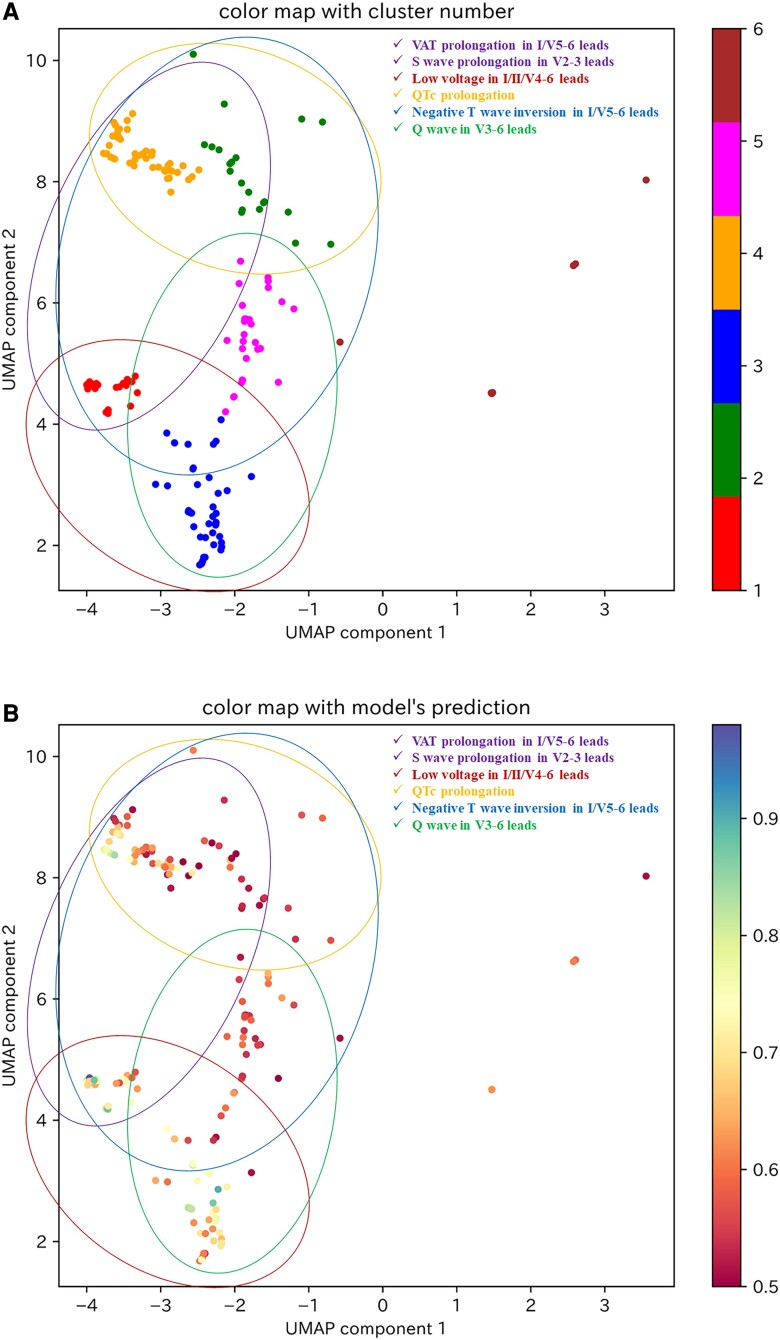
Figure 5.
The six categories of ECG findings on a visualization of the two-dimensional SHAP values for ECGs to predict reduced LVEF in the test dataset. (A) The six categories of ECG findings on a visualization of the clustered two-dimensional SHAP values for ECGs to predict reduced LVEF. (B) The six categories of ECG findings on colour mapped two-dimensional SHAP values by the model’s predictive value in ECGs to predict reduced LVEF. The purple circle represents the category of VAT prolongation in I/V5–6 leads and S-wave prolongation in V2–3 leads. The brown circle represents the category of low voltage in I/II/V4–6 leads. The orange circle represents the category of QTc prolongation. The blue circle represents the category of negative T-wave inversion in I/V5–6 leads. The green circle represents the category of Q wave in V3–6 leads. UMAP, uniform manifold approximation and projection; VAT, ventricular activation time; QTc, corrected QT interval.

