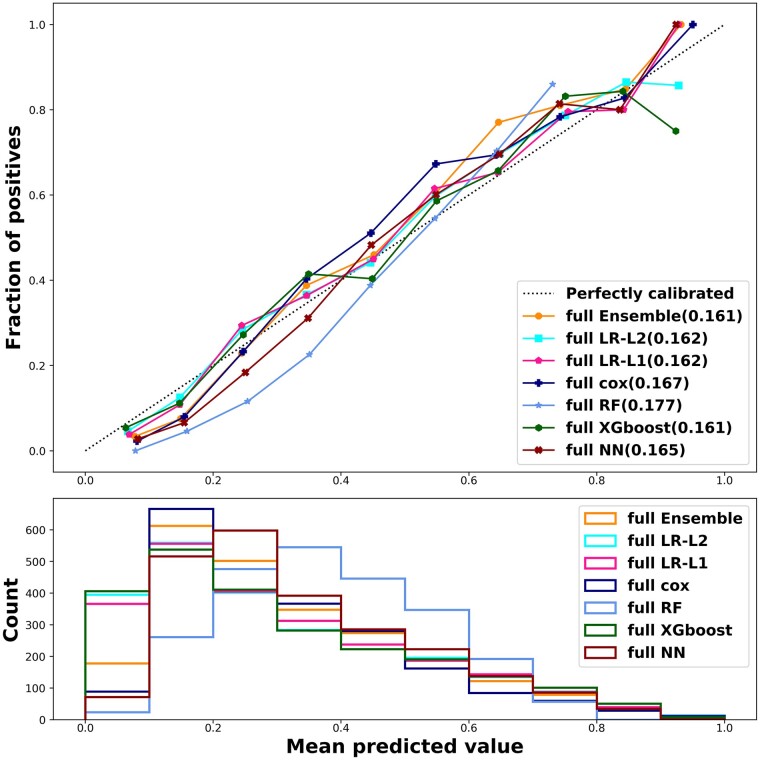
Figure 3.
Calibration plot. All models applied were reasonably calibrated (upper panel). Risk distribution of the patients evaluated using the prediction models delineates that most patients had a medium risk for the unified outcome—higher than that assessed for the 1 year mortality outcome (lower panel). The number in parentheses after each model indicates the brier score of each model. The ‘full’ prefix for each model is to indicate that it uses all the 300 + covariates. LR, logistic regression; NN, neuron network; RF, random forest; XGboost, extreme gradient boosting trees; Cox, Cox regression; Majority Ensemble, ensemble model using LR-L1, Cox, XGboost and NN.

