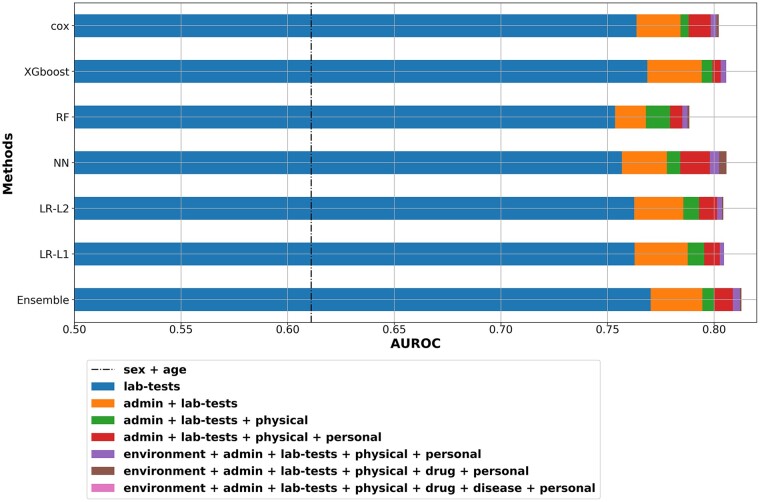
Figure 5.
Area under receiver operator curve plot by types. The relative effect of the various variable types on the performance of the prediction model is delineated. Variable types that are not shown in the graph had a minor (or negative) contribution to the model’s performance. Sex and age contribution are represented by the dashed vertical line. Admin, administrative variables; lab-tests, laboratory tests; physical, physical examination; personal, demographic variables; drug, drug treatment; disease, comorbidities; LR, logistic regression; NN, neuron network; RF, random forest; XGboost, extreme gradient boosting trees; Cox, Cox regression; Majority Ensemble, ensemble model using LR-L1, cox, XGboost and NN.

