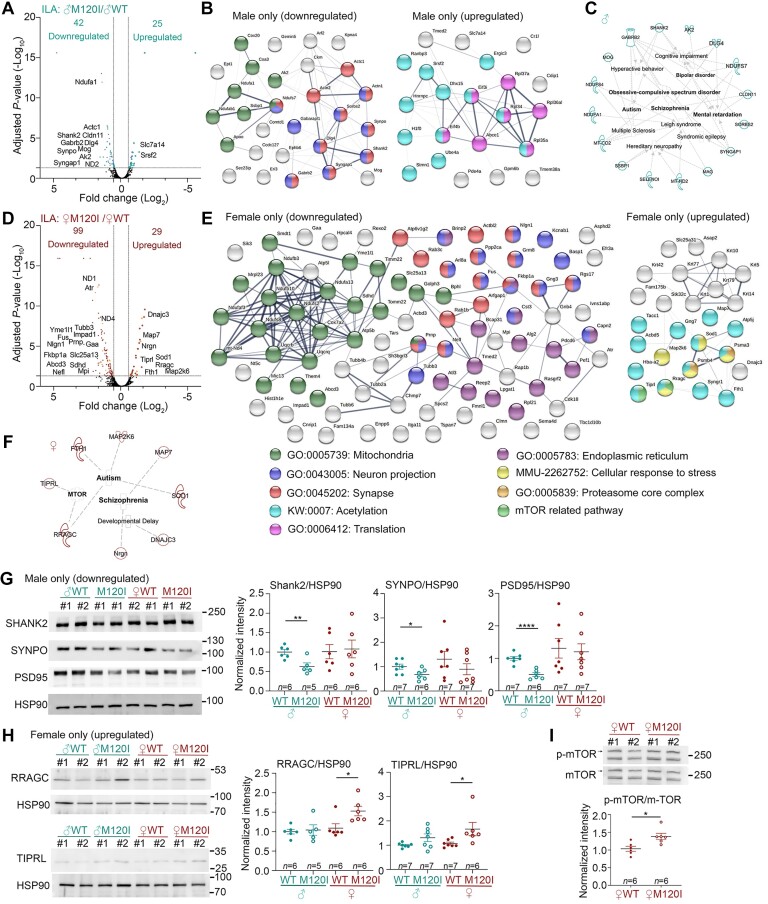
Figure 4.
Molecular features of the ILA synaptic proteome. Crude synaptosomal fractions of the ILA were isolated and analysed. Four biological replicates for each group and a total of four groups of mice (male and female WT and Cttnbp2 M120I mice) were subjected to LC-MS-MS and bioinformatic analysis. (A) Volcano plot of DEPs of male M120I (♂M120I) versus male WT (♂WT). (B) STRING protein network of DEPs of male M120I versus male WT. (C) Disease association of DEPs of male M120I versus male WT using Ingenuity Pathway Analysis (IPA). (D) Volcano plot of DEPs of female M102I (♀M120I) versus female WT (♀WT). (E) STRING protein network of DEPs of female M120I versus female WT. (F) Disease association of DEPs of female M120I versus female WT based on a literature search. For STRING, significant GOs are listed. For instance, proteins related to mitochondria, neuron projection and synapse are highly enriched in the DEP of male only (downregulated) and female only (downregulated). The group of female only (downregulated) further contains several proteins related to the endoplasmic reticulum. Protein acetylation is a common modification of the DEP in the groups of male only (upregulated) and female only (upregulated). Proteins related to translation regulation are specifically present in the group of male only (upregulated). In the group of female only (upregulated), three unique groups related to mTOR regulation, stress response and proteasome core complex are present. (G) Immunoblotting validation of male-specific downregulated DEPs, including SHANK2, SYNPO and PSD-95. (H) Immunoblotting validation of female-specific upregulated DEPs, including RRAGC and TIPRL. Protein levels were normalized to HSP90. (I) Phosphorylation levels of mTOR are higher in female M120I mice than female WT littermates. For immunoblotting in G–I, two lanes for each group in the blot represent two biological replicates labelled as #1 and #2. Each replicate contained a pool of ILA synaptosomal samples isolated from three mice. The sample size (n) indicates the number of biological replicates. The quantification data are based on three to four independent experiments and have been normalized against the levels of HSP90. Uncropped images are available in Supplementary Fig. 10. Data are presented as means ± SEM, and individual data-points are also shown. *P < 0.05, **P < 0.01, ****P < 0.0001. Two-tailed unpaired t-tests were used to analyse the differences between WT and mutant mice of the same sex. All statistical analysis and results, including the actual P-values, are summarized in Supplementary Table 7.

