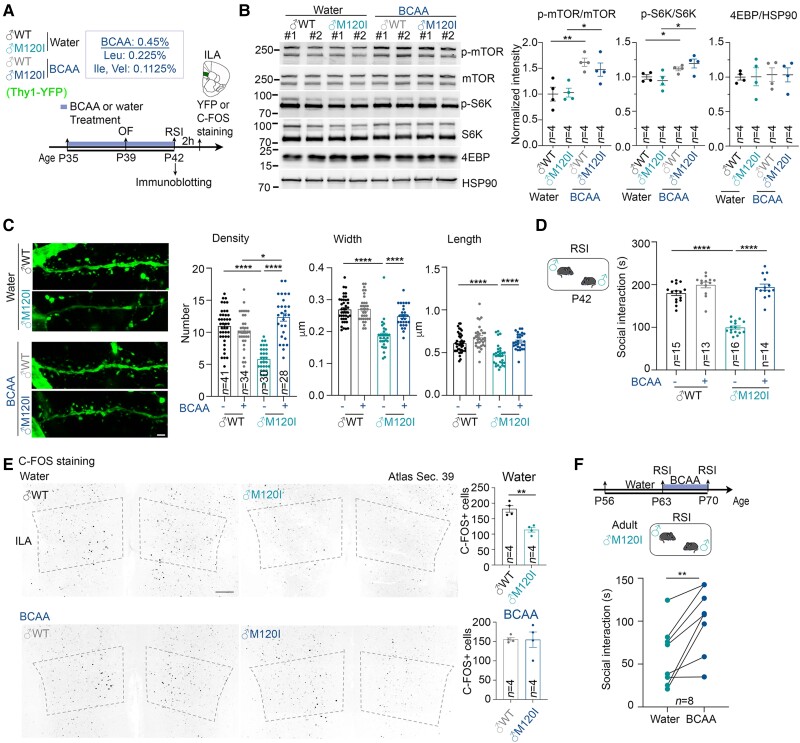
Figure 5.
BCAA supplementation increases the social interactions of male Cttnbp2 M120I mice. (A) Schematic of the experimental timeline for BCAA treatment and behavioural tests. Male mice expressing YFP under the control of the Thy1 promoter started drinking BCAA-supplemented water at P35. Mice that drank regular drinking water were included as controls. OF and RSI tests were performed at P39 and P42, respectively. Some mouse brains were collected directly after the RSI test for immunoblotting. Some mouse brains were collected 2 h after the RSI test for C-FOS or Thy1-YFP staining. (B) BCAA treatment increases mTOR activity of the mouse cerebral cortex. Left: The results of immunoblotting using different antibodies as indicated. Right: Quantification of immunoblotting. Two lanes for each group in the blot represent synaptosomal fractions prepared from different mice, #1 and #2. Four mice per group were analysed in two separate experiments. Numbers of mice examined (n) are also indicated. Uncropped images are available in Supplementary Fig. 10. (C) The density, width and length of dendritic spines of ILA neurons were analysed based on YFP signal. Left: Representative images of the first branches of apical dendrites of ILA neurons. Right: Quantitative results. Mouse numbers: four for both water- and BCAA-treated male WT (♂WT); three for both water- and BCAA-treated male M120I (♂M120I). Numbers (n) of examined neurons are indicated in the panel. (D) RSI test results at P42. Numbers of mice (n) are indicated. (E) C-FOS staining results. Left: Representative images of C-FOS staining at the ILA region. Right: C-FOS+ cell density in the ILA. Four mice for each genotype were analysed. (F) Adult M120I mice also respond to BCAA supplementation. Eight adult M120I mice were analysed. Data are presented as means ± SEM, and the results of individual mice are shown. *P < 0.05, **P < 0.01, ****P < 0.0001. (B) Two-tailed unpaired t-test was used to examine the effect of genotype. (C) Two-way ANOVA with Tukey’s multiple comparisons post hoc test. (D) Two-way ANOVA with Tukey’s multiple comparisons post hoc test. (E) Two-tailed unpaired t-test. (F) Two-tailed paired t-test. All statistical analysis and results, including the actual P-values, are summarized in Supplementary Table 7.

