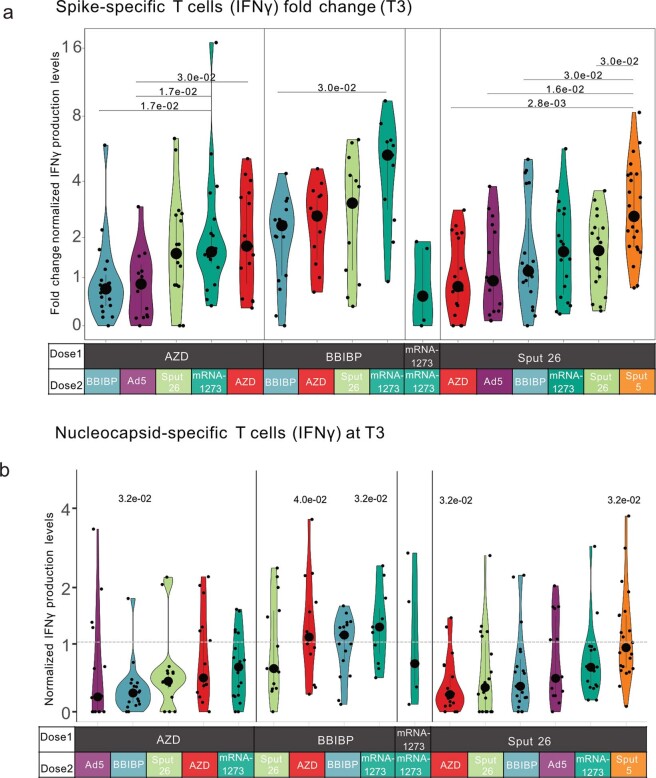
Extended Data Fig. 4. Spike- and nucleocapsid-specific cellular IFNγ responses to antigen re-encounter after different prime-boost vaccine combinations.
a, Fold change (value at T3/group mean at T1) of the IFNγ response after stimulation of PBMCs with SARS-CoV-2 spike peptide pool, measured by ELISpot assay. Statistical tests were performed between groups with the same dose 1 (n = 255). b, Normalized IFNγ responses at T3 after stimulation of PBMCs with SARS-CoV-2 nucleocapsid peptide pool, measured by ELISpot assay (n = 254). The horizontal line indicates the cut-off threshold. P values indicate differences between the respective group and the overall mean of all participants. (a-b) P-values were calculated using the Mann-Whitney-Wilcoxon test and the Benjamini-Hochberg method to correct for multiple hypothesis testing. Only significant P values (P < 0.05) are displayed. Large black dots depict the median of the group, and the vertical line spans the interquartile range.

