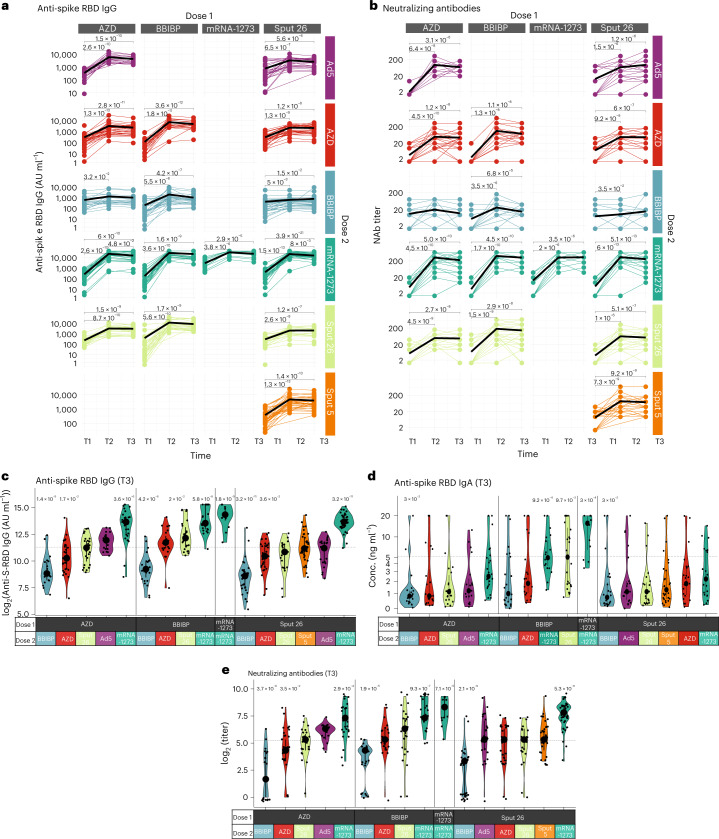
Fig. 2. Antibody response in participants after vaccination with various regimens.
a,b, Longitudinal (a) anti-S-RBD IgG levels (n = 1354) and (b) NAb titers (n = 1355) measured at timepoints T1, T2 and T3. Black lines show the median. c–e, Anti-S-RBD IgG levels (n = 420) (c), anti-S-RBD IgA levels (n = 349) (d) and NAb titers (n = 421) at T3 (e). Large black dots depict the median of each group, and the vertical line spans the interquartile range. The horizontal line shows the overall mean of all participants, and P values indicate differences between the respective group and the overall mean of all participants (c–e). P values were calculated using the Mann–Whitney–Wilcoxon test and corrected for multiple hypothesis testing with the Benjamini–Hochberg method. Only statistically significant P values (P < 0.05) are shown.

