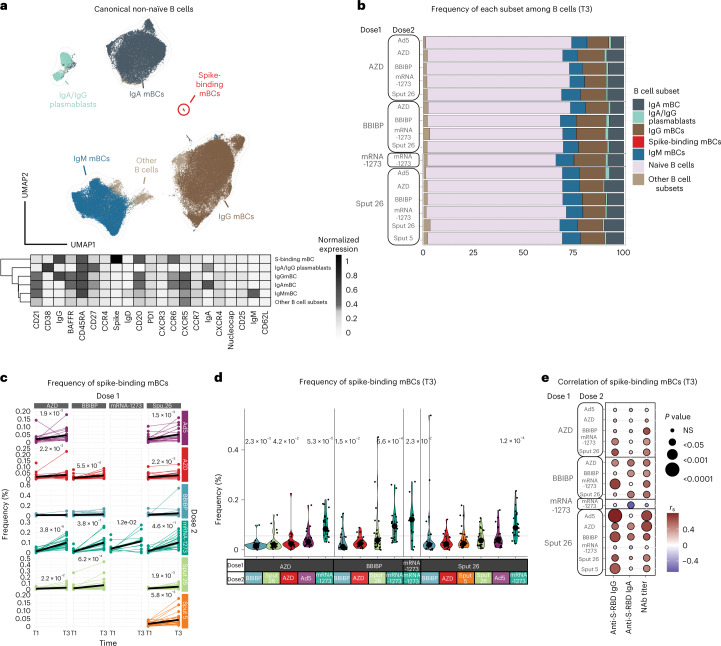
Fig. 3. Characterization of spike-binding mBCs from participants receiving different vaccine regimens.
a, UMAP showing the FlowSOM-guided manual metaclustering of nonnaive B cells (IgD−/IgM−) for all vaccine groups (n = 799). The heatmap indicates the median intensity of normalized marker expression (range: 0–1) for the identified B cell subsets. b, Relative frequencies of B cell subsets from each vaccine regimen at T3 (n = 347). c, Longitudinal analysis of spike-binding mBC frequencies among total B cells at timepoints T1 and T3. Black lines show the median (n = 754). d, Frequencies of spike-binding mBCs among total B cells at T3. Large black dots show the median of each group, and the vertical line spans the interquartile range. The horizontal line indicates the overall mean of all participants. P values (shown above groups) indicate differences between the respective group and the overall mean of all participants (n = 347). e, Correlations of spike-binding mBC frequencies with anti-S-RBD IgG levels, anti-S-RBD IgA levels and NAb titers for each vaccine regimen at T3 (n = 347). P values were calculated using the Mann–Whitney–Wilcoxon test and corrected for multiple hypothesis testing with the Benjamini–Hochberg method (c and d). Only statistically significant P values (P < 0.05) are displayed. Color indicates Spearman’s rank correlation coefficient (rs), and the bubble size indicates the P value.

