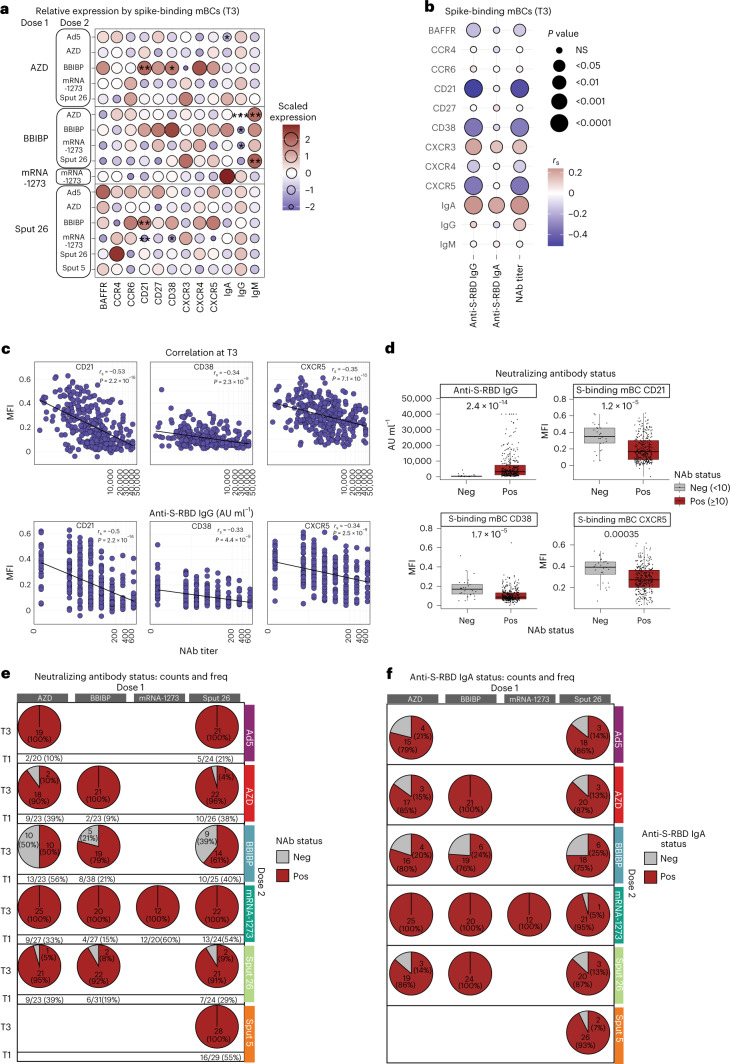
Fig. 4. Phenotypes of spike-binding mBCs from participants receiving different vaccine regimens.
a, Scaled expression of phenotypic markers by spike-binding mBCs at T3 for each group. P values indicate differences between the respective group and the overall mean of all participants for each marker (n = 347). *P < 0.05, **P < 0.01, ***P < 0.001. b, Correlations between phenotypic marker expression by spike-binding mBCs and antibody response (anti-S-RBD IgG levels, anti-S-RBD IgA levels and NAb titers) across all vaccine regimens at T3. Color indicates Spearman’s rank correlation coefficient (rs), and the bubble size indicates the P value (n = 347). c, Spearman’s rank correlations between CD21, CD38 and CXCR5 expression and anti-S-RBD antibodies and NAb titers (n = 339). d, Participants were classified as negative (<10) or positive (≥10) for NAb titers and mean antibody levels. Spike-binding mBC marker expression was compared between negative and positive participants (n = 347). Boxes bound the IQR divided by the median, and Tukey-style whiskers extend to a maximum of 1.5× IQR beyond the box. Dots are participant data points. P values were calculated using the Mann–Whitney–Wilcoxon test and corrected for multiple hypothesis testing with the Benjamini–Hochberg method (a and d). Only statistically significant P values (P < 0.05) are displayed. e, The count and percentage of participants at T1 and T3 classified as negative or positive responders, grouped by vaccine regimen (n = 407 at T1, n = 347 at T3). f, Counts and percentages of participants negative or positive for anti-S RBD IgA at T3 per vaccine regimen (n = 349). IQR, interquartile range.

