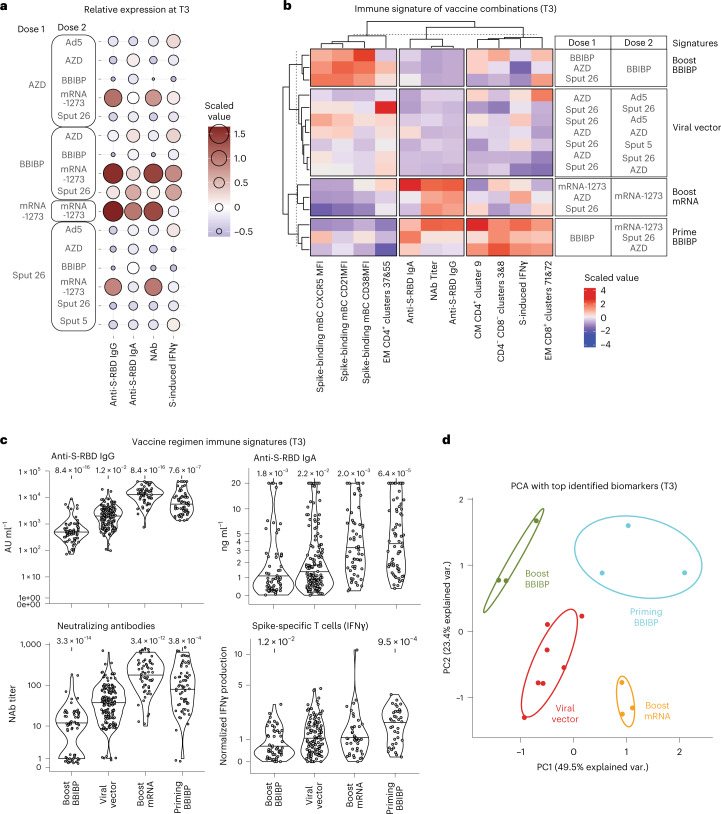
Fig. 7. Immune signatures of specific vaccine combinations.
a, Scaled and centered levels of neutralizing (NAb) and spike-specific (anti-S-RBD IgG) antibodies as well as SARS-CoV-2 spike peptide-induced T cell IFNγ production for each vaccine combination at T3 (n = 347). b, Scaled and centered values per column of the top humoral and cellular immune features for each immune signature, displayed in a heatmap with k-means clustering applied to the rows and columns (n = 347). c, Anti-S-RBD IgG levels, anti-S-RBD IgA levels, NAb titers and SARS-CoV-2 spike peptide-induced IFNγ production from all participants grouped by immune signature (n = 347). Large black dots depict the median of the group, and the vertical line spans the IQR. P values indicate differences between the respective group and the overall mean of all participants and were calculated using the Mann–Whitney–Wilcoxon test and the Benjamini–Hochberg method to control for multiple hypothesis testing. Only significant P values (P < 0.05) are displayed. d, Principal component analysis of the top humoral and cellular immune features for each immune signature at T3 (n = 347).

