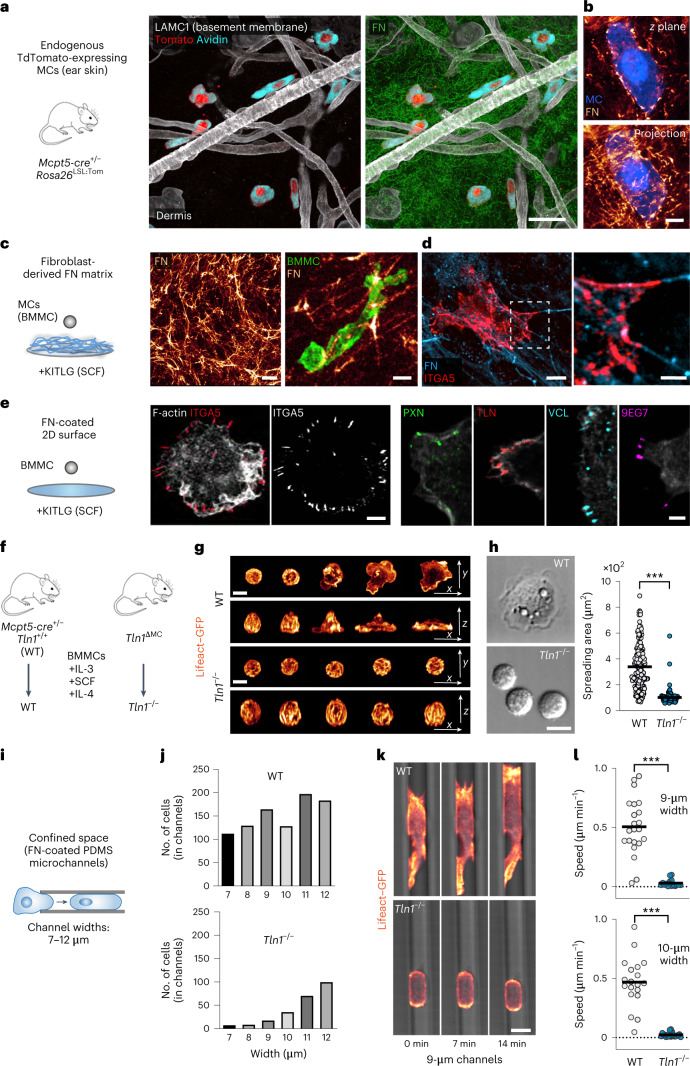
Fig. 1. MCs use integrin-dependent force coupling for adhesion to ECM and migration in microchannels.
a,b, Immunofluorescence staining of ear skin whole-mount tissue from an adult Mcpt5-cre+/– Rosa26LSL:Tom mouse. a, Tomato-expressing (red) and avidin+ (cyan) MCs in relation to LAMC1+ basement membrane components (white) and FN in the dermis. b, A Tomato-expressing (blue) interstitial MC enwrapped by dermal FN fibers (glow). A 3-µm projection is shown. c, Interactions between living Lifeact–GFP-expressing BMMCs (green) and a fibroblast-derived FN network in vitro. d, Fixed BMMCs immunostained for integrin α5 (red) display adhesion structures along FN fibers. e, Interactions between BMMCs and FN-coated glass slides in the presence of KITLG. Fixed BMMCs were stained for the focal adhesion components integrin α5, paxillin, pan-TLN, vinculin and active integrin β1 (9EG7). f, Scheme illustrating the generation of WT and Tln1−/− BMMCs. g,h, MC spreading on FN-coated 2D surfaces in response to IgE/DNP–HSA. g, Lifeact–GFP-expressing WT and Tln1−/− BMMCs. A time sequence over 20 min after DNP–HSA stimulation was acquired using live-cell microscopy. Merged projections of confocal z stacks are shown. h, Differential interference contrast images of WT and Tln1−/− BMMCs at 30 min. Analysis of the spreading area was performed after 1 h. Dots represent values of individual cells (n = 189 (WT) and 92 (Tln1−/−) BMMCs) from one of four independent experiments for each genotype. Bars display the mean; ***P < 0.0001. Data were analyzed by two-sided U-test. i, BMMC migration in the confined space of PDMS microchannels. j, WT and Tln1−/− BMMC invasion into channels of varying widths was quantified. Data from one multichannel experiment per genotype are displayed. k, Lifeact–GFP-expressing (glow) WT and Tln1−/− BMMCs migrating in 9-µm-wide channels. A time sequence over 14 min was acquired using live-cell imaging. l, Average cell speeds of individual cells in channels 9 µm (n = 22 (WT) and 16 (Tln1−/−) BMMCs) and 10 µm (n = 19 (WT) and 20 (Tln1−/−) BMMCs) wide from one multichannel experiment per genotype are shown. Bars display the mean; ***P < 0.0001. Data were analyzed by two-sided U-test. Images were acquired using confocal fluorescence microscopy (a, b, d and e) or spinning-disk confocal microscopy (c, g and k); scale bars, 30 µm (a and c, left), 5 µm (b and c, right; d, left; e, left), 2 µm (e, right), 2.5 µm (d, right) and 10 µm (g, h and k).

