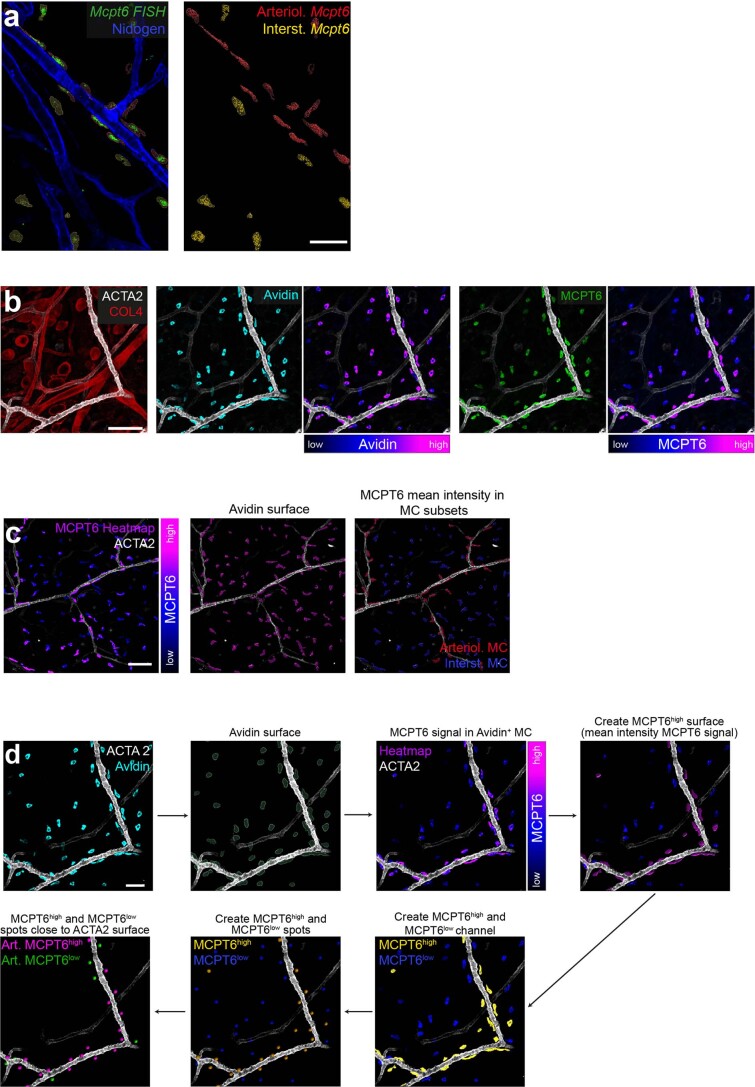
Extended Data Fig. 8. Analysis of the periarteriolar MC phenotype in situ.
(a) Representative visualization of Mcpt6 mRNA using fluorescence in situ hybridization (FISH) in ear skin whole mount tissue of adult WT mice. These data refer to the post-imaging analysis of Mcpt6 expression in periarteriolar versus interstitial MCs in Fig. 4i,j. Representative image from one of n = 4 mice. (b) Differential expression of MCPT6 in periarteriolar versus interstitial MCs. Ear skin whole mount tissue of an adult WT mouse is counter-stained for the pan-MC marker avidin (cyan), MCPT6 (green), COL4-expressing basement membranes (red) and ACTA2-positive arterioles (white). Avidin and MCPT6 fluorescence intensities are also displayed as heatmap. (c,d) Imaris software-based workflows for the post-imaging analysis of MCPT6 mean fluorescence intensities in MC subsets (c) and calculation of the percentage of MCPT6high MCs of all periarteriolar MCs in WT and Tln1ΔMC mice (d). (b-d) Representative images from one experiment of n = 5 mice. Scale bars: 50 µm (a, d), and 100 µm (b,c).

