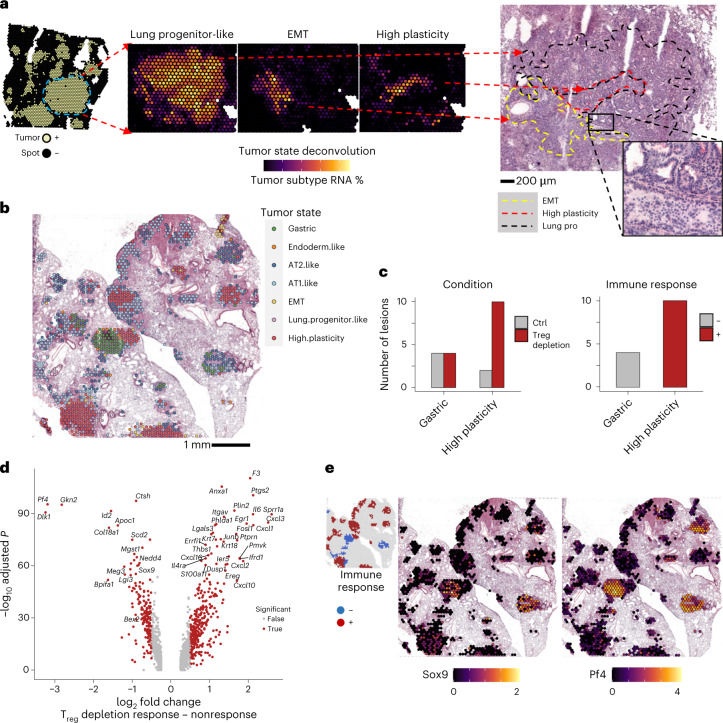
Fig. 5. High-plasticity state and heterogeneity revealed by lung adenocarcinoma responses to Treg cell depletion.
a, ST analysis of tumor states. BayesPrism deconvolution using additional labeled tumor cells from Yang et al.28 was performed to assign tumor-state-specific RNA fractions. Correspondence of regions with highlighted differential tumor states (middle) to H&E section is shown (right). Dashed lines denote regions with the indicated dominant tumor states (red, high plasticity; yellow, EMT; black, lung progenitor-like). b, Spots labeled by tumor-state cluster. In a and b, images are representative of, and analysis performed on (c and d), one of two serial sections for each of four samples (DT and Ctrl, two biological replicates each). c, Quantification of tumor lesion area types across Treg cell depletion and control conditions (left) or between tumors with or without detectable immune response in Treg cell-depleted condition (right; N = 85 lesion areas). d, Differential gene expression (two-sided Wilcoxon test Benjamini–Hochberg adjusted) of tumor spots in lesions with and without immune response to Treg cell depletion. e, Log-normalized expression of Sox9 and Pf4 (Cxcl4) in a representative tumor-bearing lung section after Treg cell depletion. Inset at top left indicates immune response status of tumor lesion areas.

