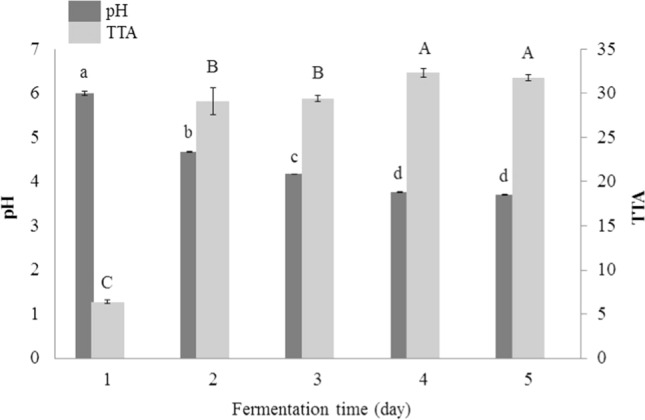
Fig. 1.

pH and total titratable acidity (TTA; as mL of the consumed 0.1 N NaOH) changes during daily back-slopping of quinoa sourdough. Different lowercase and uppercase letters indicate significant differences at P < 0.05 among the pH and TTA values, respectively
