Fig. 5.

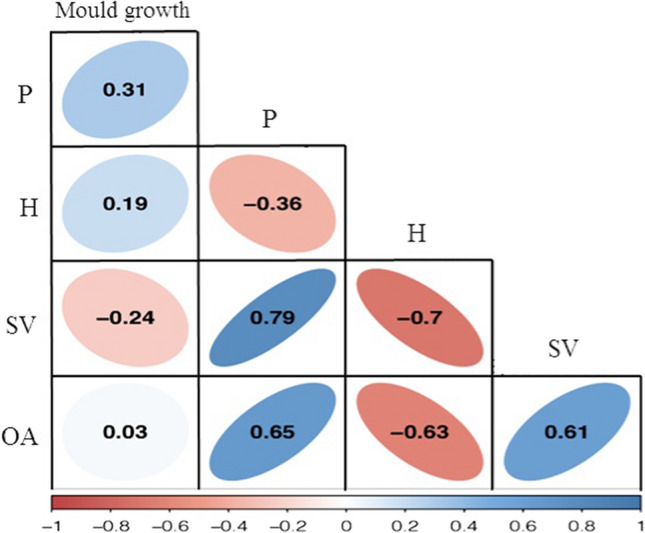
Correlation among the quality characteristics of the produced breads using “Corrplot” package in “R” software. P: porosity, H: crumb hardness, SV: loaf specific volume and OA: overall acceptability

Correlation among the quality characteristics of the produced breads using “Corrplot” package in “R” software. P: porosity, H: crumb hardness, SV: loaf specific volume and OA: overall acceptability