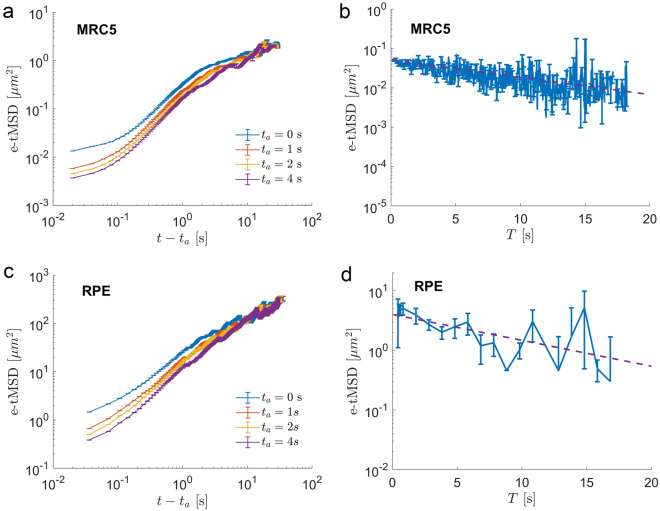
Figure 6.
Diffusion of endosomes shows ageing behaviour. (a,c) e-tMSD as a function of time t show clear dependence on the aging time . Different curves correspond to e-tMSDs calculated for different aging times. The error bars correspond to standard errors. (b,d) The e-tMSDs as functions of the duration of trajectories, T, calculated at s. The error bars represent the standard error of the mean. The dashed lines are fit by the exponential function with parameters a, b and their 95% confidence intervals given by for (b) and 1.5337, 0.1423 for (d) .

