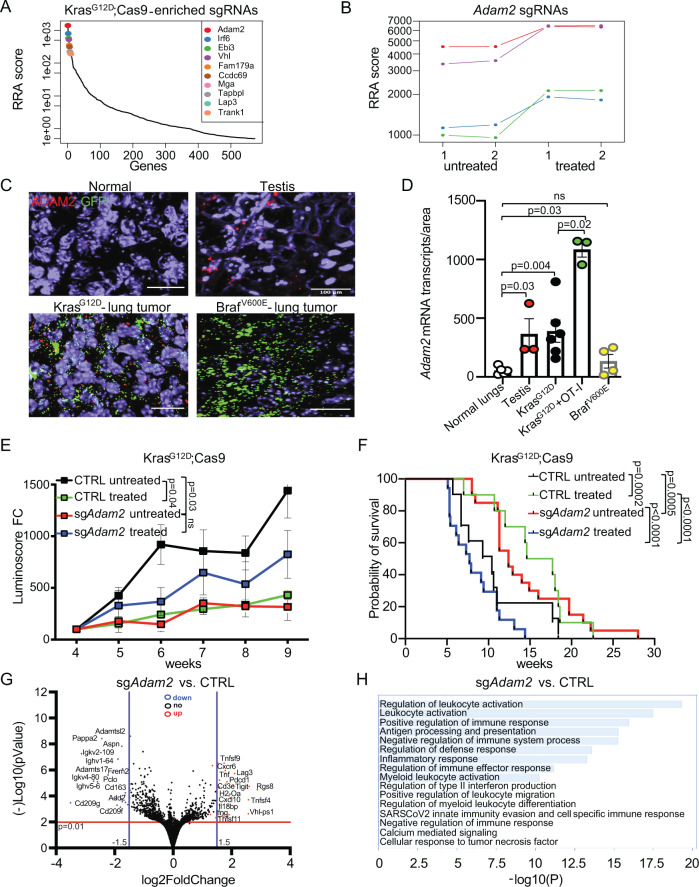
Fig. 3 ADAM2 regulates leukocyte activation and cytokines in Kras-driven lung cancer.
A Top 10 genes whose sgRNAs are enriched in lungs of ACT-treated KrasG12D;Cas9 mice. (untreated n = 10; treated n = 10; RRA, Robust Rank Aggregation, which identifies statistically significant enriched genes across the two experimental conditions with the p values gained from the negative binomial (NB) model used by MAGeCK RRA to rank the sgRNAs). B Relative abundance of 4 different sgRNAs targeting Adam2 depicted by different colors in 2 replicates of untreated and 2 replicates of ACT-treated KrasG12D lungs (n = 5 lungs for each replicate). C RNAscope analysis of Adam2 (red) and GFP (green; tumor cells) expression in indicated tissues (n = 5 normal lungs; n = 3 testis; n = 6 KrasG12DCas9; n = 3 KrasG12DCas9 + OT-I; n = 4 BrafV600ECas9 biologically independent samples). The scale bar represents 100 µm. D Quantification of Adam2 transcripts from (C) with p values calculated by unpaired two-sided student’s t-test; ns non-significant; data are mean ± s.e.m. E Growth curves of tumors in KrasG12D;Cas9 mice transduced with sgNTC (CTRL untreated n = 8; CTRL treated n = 12) or sgAdam2 (untreated n = 14; treated n = 17; sg1 and sg2 are shown combined here and are shown separately in Supplementary Fig. 11d, e). The p values for tumor growth were determined by an unpaired two-sided t-test with Welch’s correction. The data are presented as the mean ± SEM. F Tumor-free survival of KrasG12D;Cas9 mice transduced with sgNTC (untreated, n = 10; treated, n = 10) vs. sgRNA sgAdam2 (untreated, n = 20; treated, n = 18; sg1 and sg2 are shown combined here and are shown separately in Supplementary Fig. 11f, g); Comparison of survival curves was performed by Log-rank (Mantel–Cox test). Data are mean ± s.e.m. G Volcano plot showing differentially expressed genes (DEGs) in sgAdam2 KO (n = 4) compared to CTRL (n = 4) lung tumors isolated from C57BL/6 mice, where log2 FC indicates the mean expression and (−)log10 adjusted p value level for each gene. The blue dots denote downregulated gene expression, the red dots denote upregulated expression, and black dots denote the gene expression without marked difference. Data represents three independent biological samples for each group. H Bar graph showing Gene Ontology of the DEGs (FC > 2, p < 0.05) downregulated in sgAdam2 KO compared to CTRL lung tumors assigned to Biological Process.

