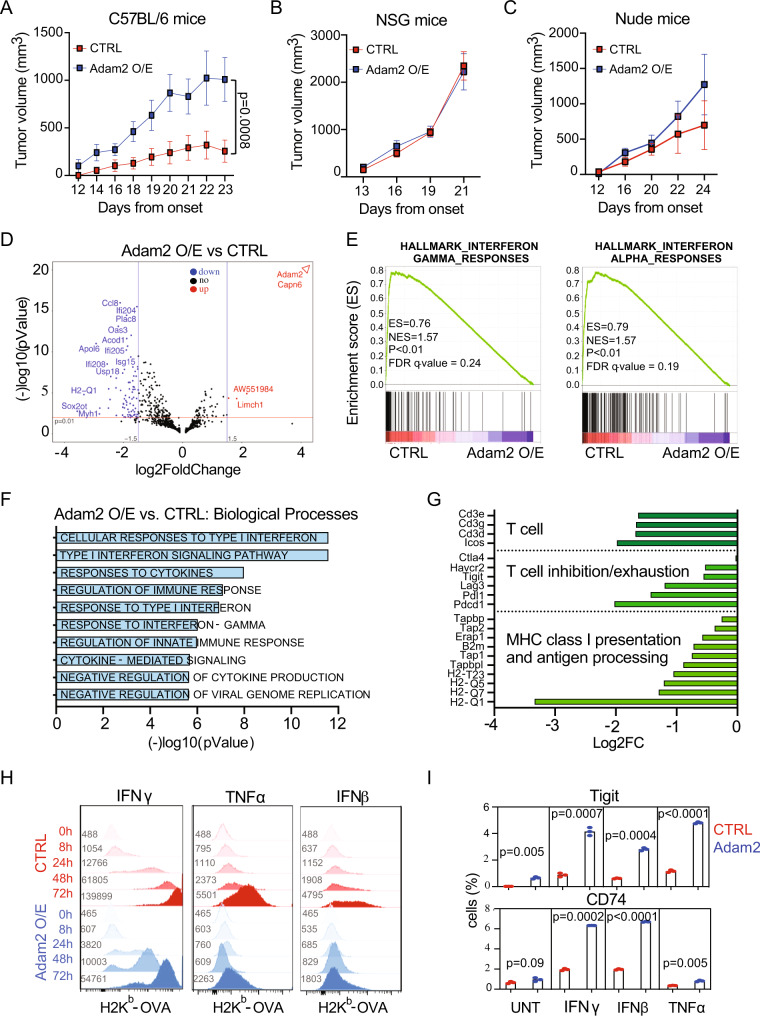
Fig. 4. ADAM2 promotes tumorigenesis by suppressing IFN and TNF immune responses.
A–C Tumor growth of CTRL and Adam2 O/E LLC cells allografted subcutaneously into C57BL/6 mice (A, n = 4 CTRL, n = 5 Adam2), NSG mice (B, n = 8) and Nude mice (C, n = 5) examined over three independent experiments. The p values for tumor growth were determined by an unpaired two-sided t-test with Welch’s correction. The data are presented as the mean ± SEM. D Volcano plot showing differentially expressed genes (DEGs) in Adam2 O/E compared to CTRL tumors isolated from C57BL/6 mice, where log2 FC indicates the mean expression and (−)log10 adjusted p-value level for each gene. The blue dots denote downregulated gene expression, the red dots denote upregulated expression, and black dots denote the gene expression without marked difference. Data represents three independent biological samples for each group. E GSEA plots showing Hallmarks of IFNγ and IFNα pathways between Adam2 O/E compared to CTRL tumors isolated from C57BL/6 mice (A) with FDR < 25% and p < 1%. F Bar graph showing Gene Ontology of the DEGs (FC > 2, p < 0.05) downregulated in Adam2 O/E compared to CTRL tumors assigned to Biological Process isolated from C57BL/6 mice (A). G Bar graph depicting selected downregulated genes in Adam2 O/E compared to CTRL tumors categorized by immune function isolated from C57BL/6 mice (A). H Cell surface expression of MHC-I H2Kb-OVA on CTRL and Adam2 O/E LLC cells after treatment with 100 ng/ml of IFNγ, IFNβ or TNFα over the indicated time course. Numbers denote mean fluorescence intensity (MFI). I Percentage of CTRL and Adam2 O/E LLC cells expressing CD74 and Tigit after IFNγ, IFNβ or TNFα treatment (100 ng/ml each, 24 h). Data presents mean ± s.e.m. of three technical replicates analyzed by two-sided student’s t-test examined. One representative experiment out of three independent experiments is shown.

