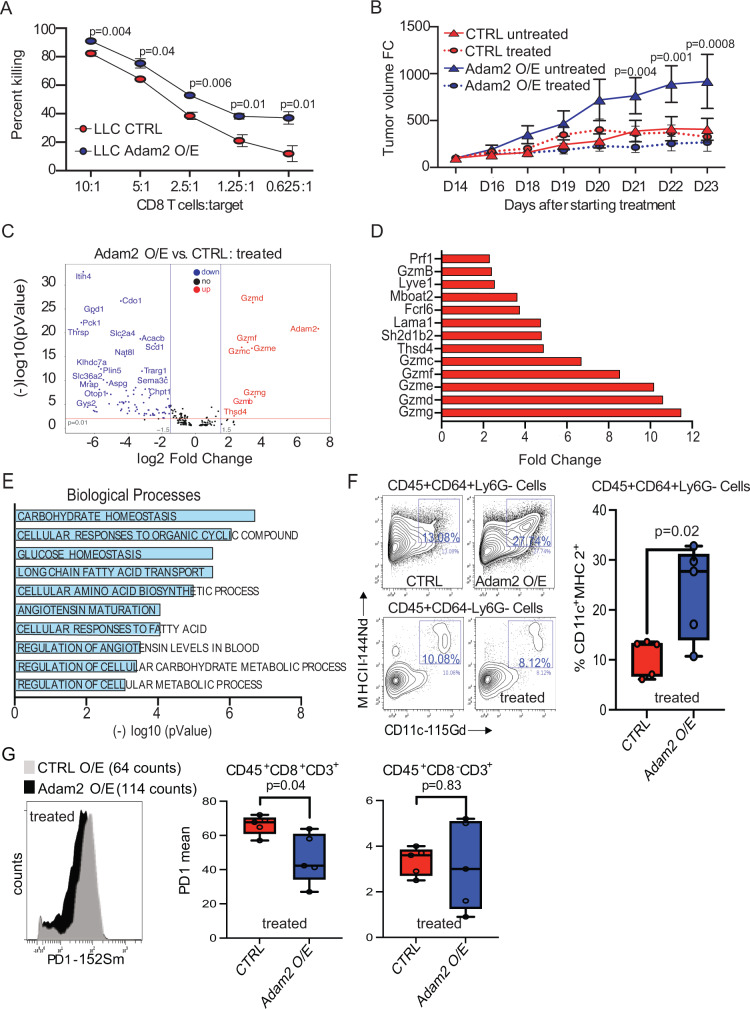
Fig. 5. ADAM2 increases cytolytic activity of TAA-specific CD8 T cells.
A The effect of Adam2 overexpression in LLC cells on CD8+ OT-I T-cell-mediated killing. CTRL or Adam2 O/E cells labeled with CFSE were used as targets (T) and cocultured with activated OT-I CD8 T cells (E) at different E:T ratios. Flow cytometry analysis was used to calculate the ratio of killed cells at different E:T ratios. Data presents mean ± s.e.m. of four technical replicates analyzed by two-sided student’s t-test examined. One representative experiment out of three independent experiments is shown. B Tumor growth of CTRL or Adam2 O/E LLC cells allografted into C57BL/6 mice, which were subsequently treated with OT-I T cells (n = 4) or left untreated (n = 4). Three independent experiments were performed. C Volcano plot showing differentially expressed genes in OT-I treated CTRL and Adam2 O/E tumors isolated from C57BL/6 mice where log2 FC indicates the mean expression and (−)log10 adjusted p value level for each gene. The blue dots denote downregulated gene expression, the red dots denote upregulated expression, and black dots denote the gene expression without marked difference. Data represents three independent biological samples for each group. D Bar plot showing 12 top upregulated genes between OT-I treated Adam2 O/E versus CTRL tumors isolated from C57BL/6 mice. Data represents three independent biological samples for each group. E Bar graph showing Gene Ontology of the DEGs (FC > 2, p < 0.05) downregulated in OT-I treated Adam2 O/E compared to CTRL tumors assigned to Biological Process. Data represents three independent biological samples for each group. F CyTOF analysis showing the expression of MHCII and CD11c in CD45+ CD64+ Ly6G− cells from OT-I treated CTRL and Adam2 O/E tumors isolated from C57BL/6 mice (n = 6 biologically independent samples for each group examined over two independent experiments). Box and whiskers plots illustrate the median, first and third quartiles, maximum and minimum of relative MHCII and CD11c abundance between two groups analyzed by two-sided student’s t-test. G CyTOF analysis showing PD1 surface expression on pre-gated CD45+CD8+CD3+ cell population from OT-I treated CTRL and Adam2 O/E tumors isolated from C57BL/6 mice. Bar plots representing the frequency of PD1 surface expression on CD45+CD8+CD3+ and CD45+CD8-CD3+ cells from OT-I treated CTRL and Adam2 O/E tumors isolated from C57BL/6 mice (n = 6 for each group examined over two independent experiments). Box and whiskers plots illustrate the median, first and third quartiles, maximum and minimum of relative PD1 abundance between two groups analyzed by two-sided student’s t-test.

