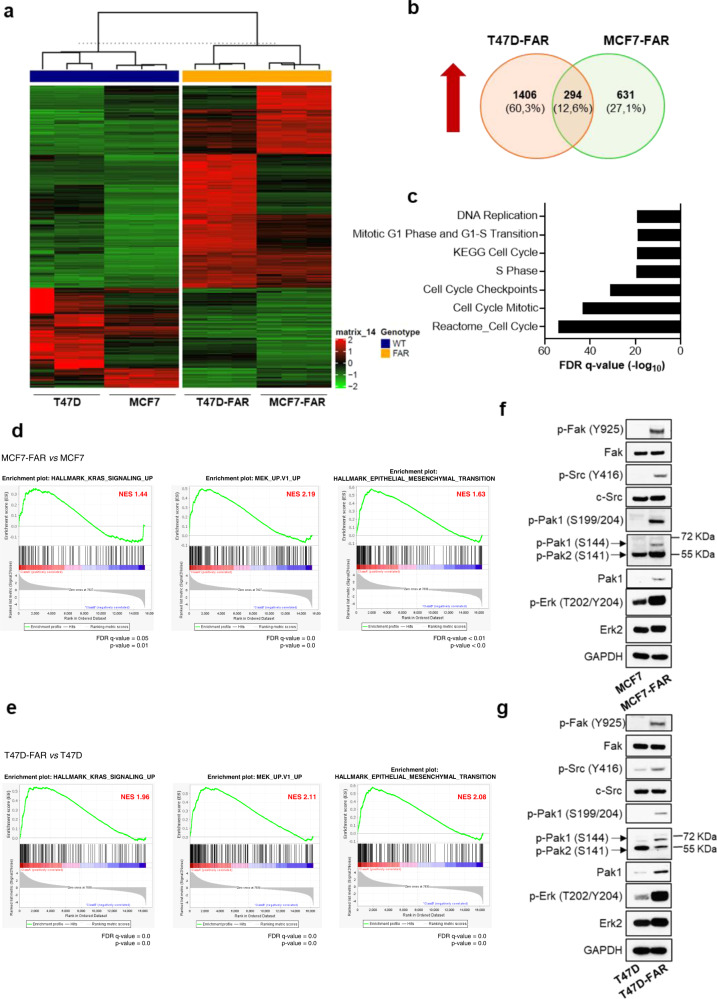
Fig. 2. Evaluation of the common transcriptional reprogramming underpinning drug resistance to fulvestrant and abemaciclib in ER+ breast cancer cell lines.
Heatmap of hierarchical clustering indicating differentially expressed genes (rows) between parental and FAR cells (a). Venn-diagram of common up-regulated genes between MCF7-FAR and T47D-FAR is shown in (b). Bar graphs showing gene set names obtained by Gene Set Enrichment Analysis (GSEA) of common 294 up-regulated genes between MCF7-FAR and T47D-FAR cells. Data are plotted for False Discovery Rate (FDR) q-value (c). RNA-seq based GSEA of pathways significantly up-regulated in FAR resistant vs parental MCF7 and T47D cells are shown with Normalized Enriched Score (NES) and FDR q-value and p-value (d, e). Western blot analysis of sensitive MCF7 and T47D or resistant FAR collected after 18 h of treatment with fulvestrant (1 µM) and abemaciclib (0.25 µM) (f, g, respectively). Whole cell lysates were prepared and subjected to immunoblot analysis with the indicated antibodies. Images are representatives from three independent experiments.

