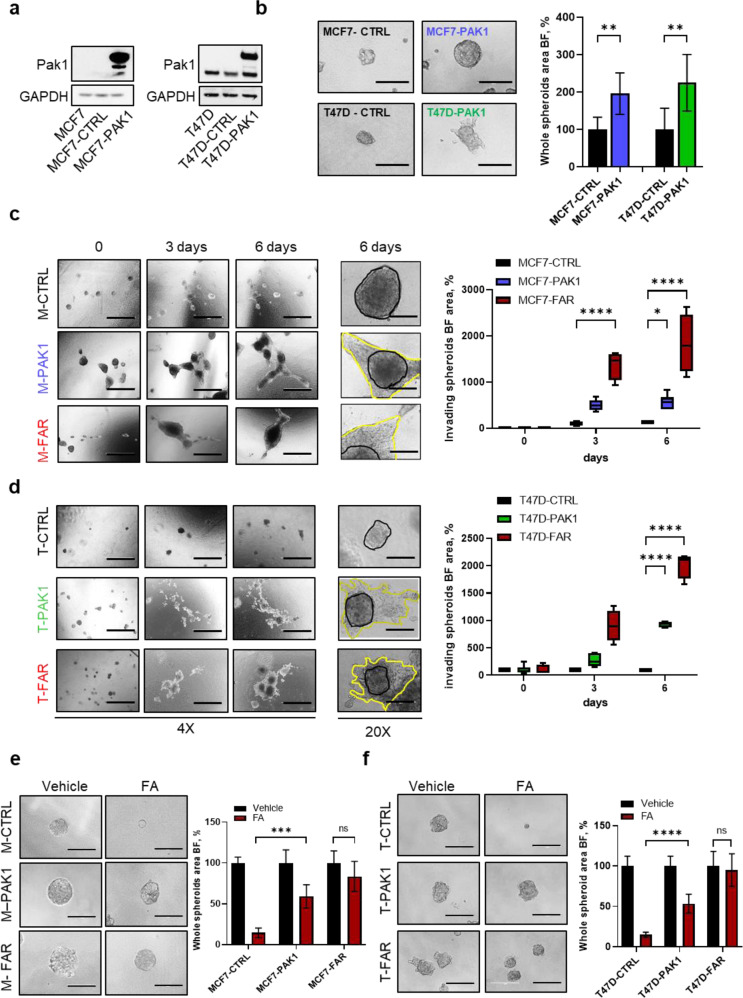
Fig. 3. Effects of PAK1 over-expression on cell proliferation and invasion in MCF7 and T47D cells.
Representative western blot analysis for Pak1 of parental MCF7 (left) and T47D (right), GFP vector control (pLenti-C-mGFP-P2A-Puro) over-expressing cells (MCF7-CTRL and T47D-CTRL) or PAK1-over-expressing cells (MCF7-PAK1 and T47D-PAK1). GAPDH was used as a loading control (a). Representative images of MCF7-CTRL or -PAK1 and T47D-CTRL or -PAK1 (left) spheroids cultured for 72 h. All images were capture at 20x magnification (Bars = 200 µm). Bar graph shows the whole spheroids area plotted as percentage relative to spheroids CTRL area (right) (b). Representative images of spheroids from MCF7-CTRL or -PAK1 or -FAR cells (c) and T47D-CTRL or -PAK1 or -FAR cells (d) embedded into a collagen type I matrix at different time points. All images were capture at 4x magnification (Bars = 1000 µm), or 20x magnification (scale bar = 200 μm). Box plots showing spheroid invading area are reported for MCF7 (c, right) and T47D (d, right) models. Data are plotted with median and SD. Representative images of MCF7-CTRL, -PAK1 or –FAR (e, left) and T47D-CTRL, -PAK1 or –FAR (f, left) spheroids treated for 72 h with vehicle or with the combination of 400 nM of fulvestrant and 100 nM of abemaciclib (FA). Magnification 20x (scale bar = 200 μm). Bar graphs showing percentage of whole spheroids area upon FA treatment compared to spheroids treated with vehicle (plotted as 100%) are reported for MCF7 (e, right) and T47D (f, right) models. For panels b, e, f right, data are expressed as mean ± SD performed in quadruplicate. For al panels (*p < 0.05; **p < 0.01, ***p < 0.001; ****p < 0.0001; 2way ANOVA Bonferroni’s multiple comparisons).

