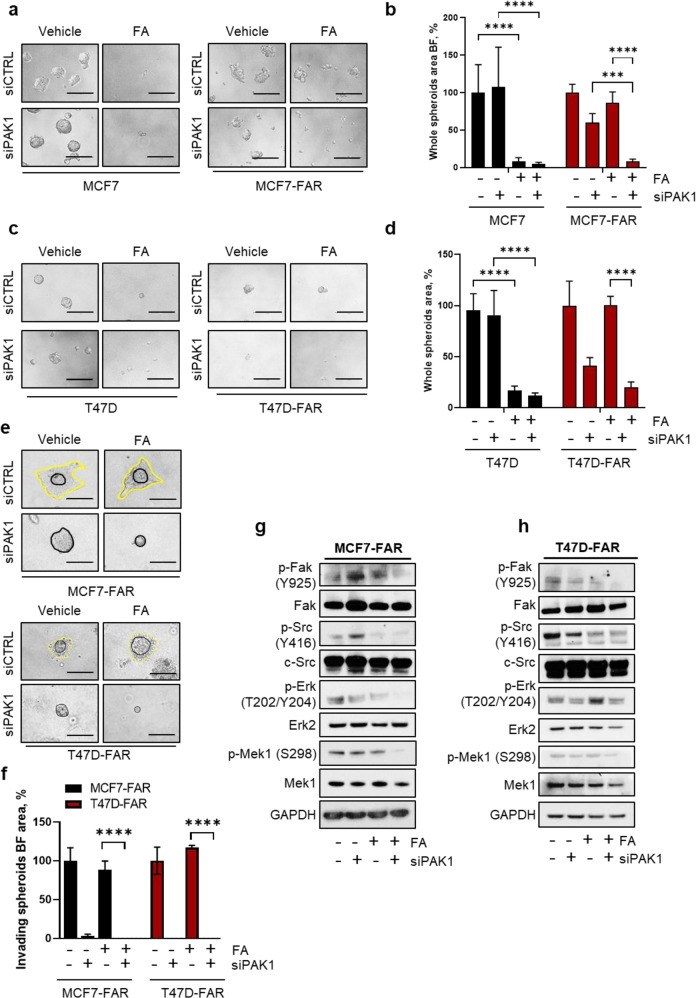
Fig. 4. PAK1 knock-down as key event in increasing resistant cell sensitivity to fulvestrant and abemaciclib.
Representative images of MCF7 (a, left) and MCF7-FAR (a, right) or T47D (c, left) and T47D-FAR (c, right) spheroids transfected with siRNA scrambled (siCTRL) or siRNA targeting PAK1 (siPAK1) for 72 h and treated with vehicle or the combination of 400 nM of fulvestrant and 100 nM of abemaciclib (FA) for other 72 h. Magnification 20x (scale bar = 200 μm). Bar graphs showing percentage of whole spheroids area upon FA treatment ± siPAK1 compared to spheroids treated with vehicle (plotted as 100%) are reported for MCF7 and MCF7-FAR (b) and T47D and T47D-FAR (d) cells (a–d). Representative images of spheroids from MCF7-FAR (e, top) and T47D-FAR (e, bottom) knocked-down for PAK1 and treated with vehicle or the combination of 400 nM fulvestrant and 100 nM abemaciclib (FA) embedded in collagen type I matrix for 6 days. Magnification 20x (scale bars = 200 μm). Bar graph showing quantification of invading spheroids area upon silencing of PAK1 and in presence or not of FA (f). Data are plotted as percentage relative to cells transfected with scrambled siRNAs and treated with vehicle (f). Representative western blot analysis for the indicated antibodies of MCF7-FAR (g) or T47D-FAR (h) total lysates of cells silenced for PAK1 for 72 h and treated for further 72 h with 1 μM of fulvestrant and 0.25 μM of abemaciclib (FA). GAPDH was used as loading control. Images are representatives of three independent experiments. For all panels, data are plotted as means±SD of three independent experiment performed in quadruplicate (***p < 0.001; ****p < 0.0001; 2way ANOVA Bonferroni’s multiple comparisons).

