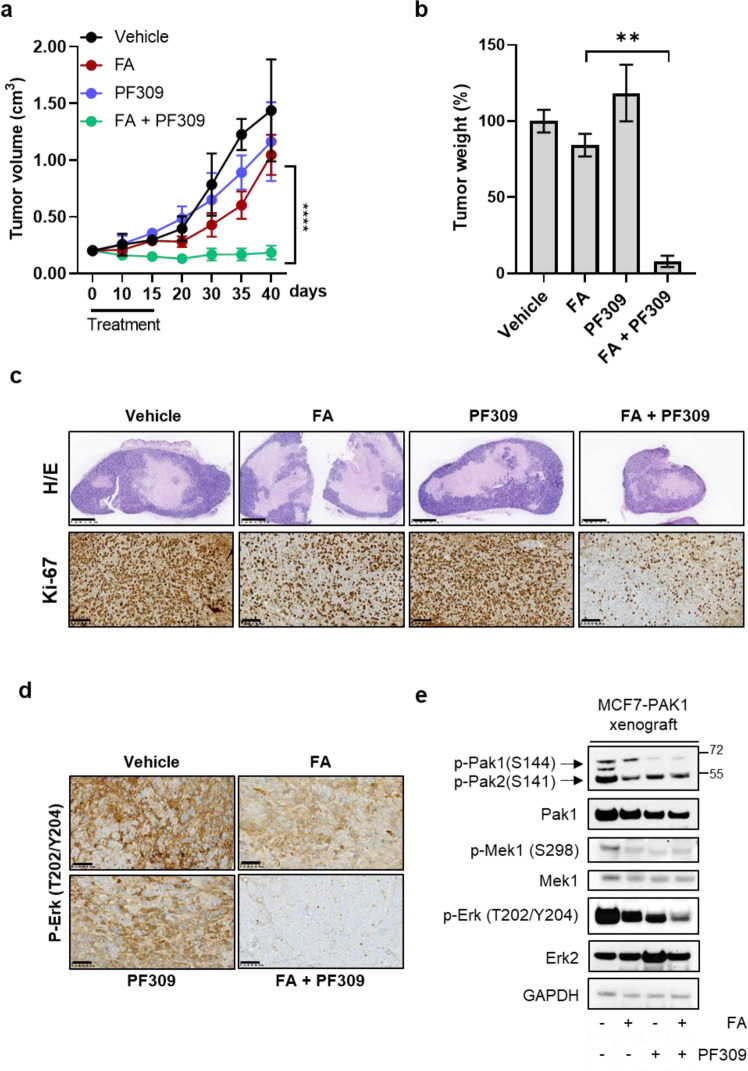
Fig. 6. Tumor xenograft growth impairment and drug resistance reversion upon Pak1 pharmacological inhibition.
MCF7-PAK1 xenografts were established in Balb/c nude mice. Once tumors reached ≥200 mm3, mice were randomized to treatment with vehicle, fulvestrant and abemaciclib (FA; 5 mg/week, 25 mg/kg p.o., respectively), PF309 (15 mg/kg p.o.) alone or in combination. Tumor growth curve is showed in a. Each data point represents the mean of tumor volume in cm3 ±SD (n = 5 per arm, ****p < 0.0001 vs. FA drug arms; Student’s t-test). At the end of the treatment tumours were collected, weights were measured and reported in bar graph as percentage relative to vehicle-treated control (b). Representative images of MCF7-PAK1 xenografts’ sections stained with Hematoxylin and eosin (H/e) or processed for Ki67 staining are showed in c (top panels and bottom panels, respectively). Images were capture at 2.5x (top panels) or 20x magnification (bottom panels); bars=1000 µm or 100 µm, respectively. Representative images of MCF7-PAK1 xenografts’ sections subjected to IHC for p-ERK (T202/Y204) (d). All images were capture at 20x magnification (Bars=100 µm). Western blot analysis of proteins extracted from MCF7-PAK1 tumor xenografts after 4 h of treatment and blotted for the indicated antibodies (e). Images are representatives from three independent experiments.

