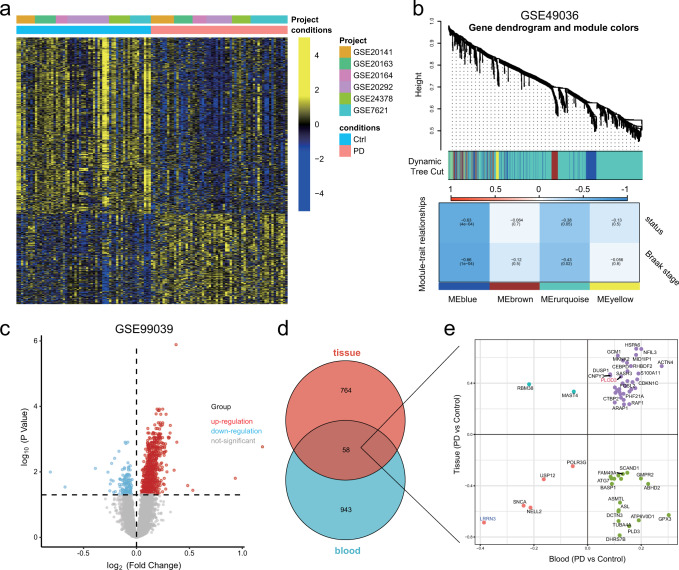
Fig. 2. Integrated analysis of tissue and blood samples from PD and control patients.
a Heat map visualization of 921 differentially expressed genes (DEGs) between PD and control nigrostriatal (SN) RNA. b The weighted gene co-expression network analysis (WGCNA) was performed with the DEGs expression data to identify the Braak stage related models. c Volcano map visualization of 1001 DEGs between PD and control blood samples of GSE99039. d, e Venn diagrams and scatter plots show the distribution of the overlapping 58 genes.

