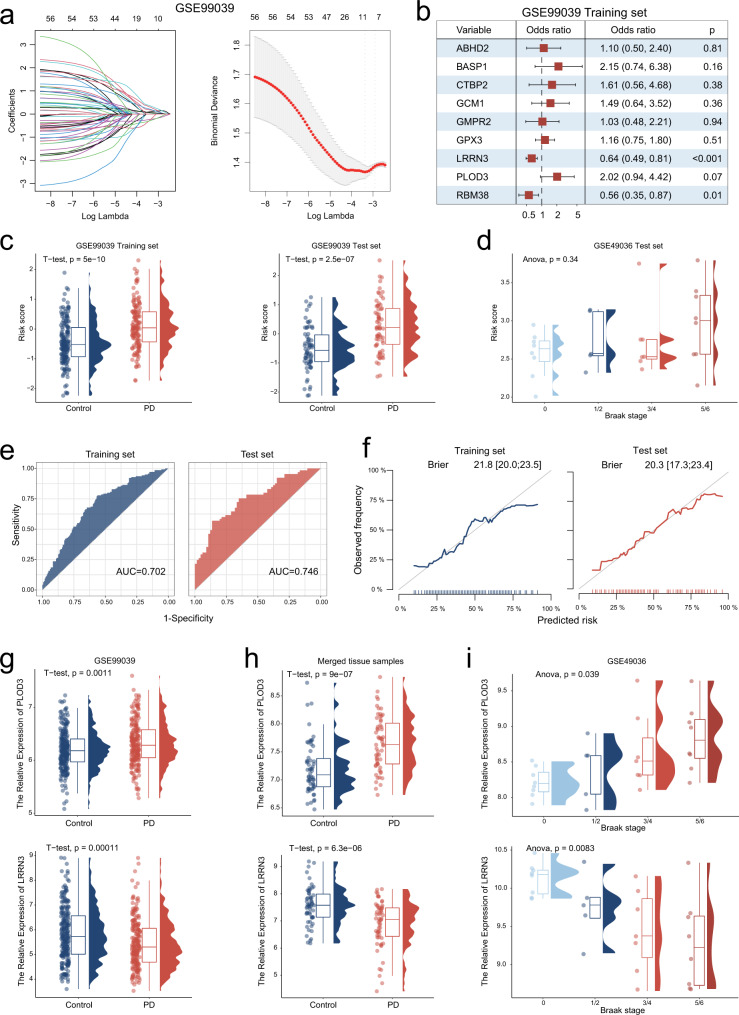
Fig. 3. Identification of a PD gene signature consisting 9 biomarker genes.
a Least absolute shrinkage and selection operator (LASSO) coefficient profiles (y-axis) of the 58 overlapping genes (left panel). The dashed line on the left represents the optimal value of λ, which corresponds to the number of genes on the x-axis (right panel). b Multivariate logistic regression model analysis, which included the nine genes in the training set of GSE99039. The forest plot displays the odds ratio (OR) values and their 95% confidence intervals from various genes. Each square represents a gene, with the position of the square indicating the OR value and the horizontal line representing the 95% confidence interval. c The differences of risk score between PD and control groups for training set and test set of GSE99039. d The differences of risk score between different braak stage PD patients of GSE49036 e Receiver operating characteristic (ROC) curves for the risk score model both in the training and test sets. f The calibration curves of risk score predictions for the training and test sets are close to the ideal performance (45 degrees line). g, h The differences of PLOD3 and LRRN3 expression between PD and control groups of GSE99039 (g) and merged SN tissue samples (h), respectively. i The differences of PLOD3 and LRRN3 expression between different Braak stages groups of GSE49036. Boxplots summarize the distribution of the data. The box represents the interquartile range, with the horizontal line inside the box indicating the median. The whiskers extend to the minimum and maximum values within 90% of the data range and the shape of the violin provides insights into the data distribution.

