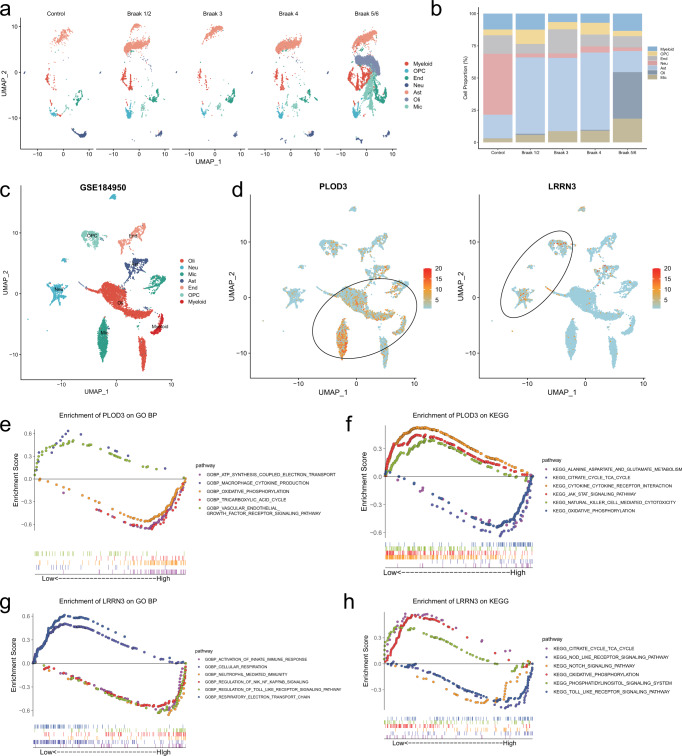
Fig. 4. Single-cell RNA analysis reveals the functions of PLOD3 and LRRN3.
a UMAPs of control and different Braak stages PD brain samples. b Cluster composition of myeloid, oligodendrocyte progenitor cells (OPC), endothelial cells (End), neurons (Neu), astrocytes (Ast), oligodendrocytes (Oli), and microglia (Mic) from snRNA sequencing. c, d Single-cell RNA sequencing of GSE184950 visualizing UMAP cell clusters, PLOD3 and LRRN3 expression. The cellular subpopulation expression of the PLOD3 and LRRN3 has significant distributional variability. The expression of PLOD3 was more enriched in astrocytes, microglia and oligodendrocytes cell clusters, whereas LRRN3 was more enriched in neurons and oligodendrocyte progenitor cells clusters. e–h The combined GSEA curves using GO-BP and KEGG analysis visualize the functions of PLOD3 and LRRN3.

