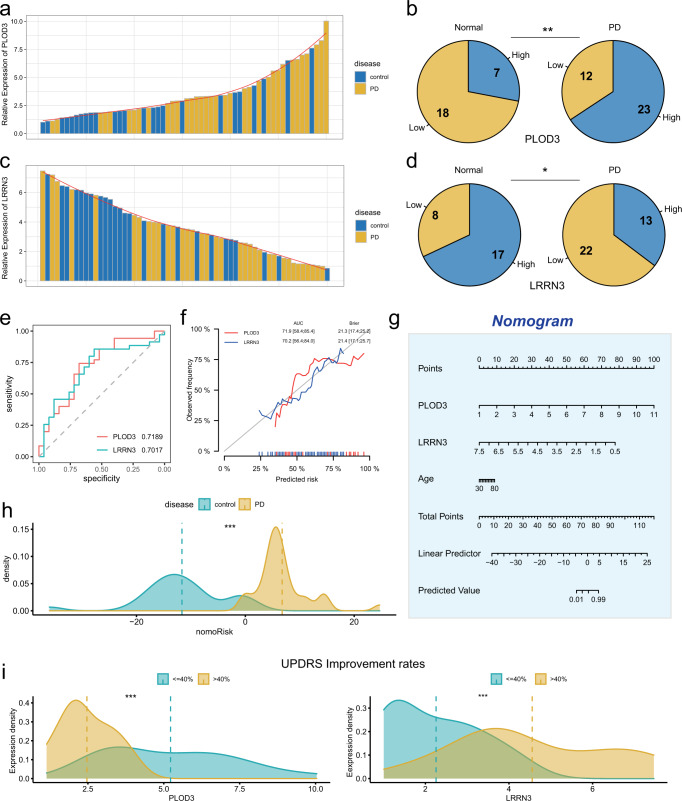
Fig. 5. Validation the expression of PLOD3 an LRRN3 in blood samples.
a, c The bar chart showing the relative expression of PLOD3 and LRRN3 in PD and control blood samples. b, d Pie charts showing the distribution of PLOD3-Low/High (b) and LRRN3-Low/High (d) expression in control and PD blood samples. e, f ROC curves and calibration curves for the expression of PLOD3 and LRRN3 in Qilu cohort. g Nomogram based on the expression of PLOD3, LRRN3 and age for predicting the incidence of PD in Qilu cohort. h The differences of nomoRisk between control and PD. i The differences in PLOD3 and LRRN3 expression between PD patients with high and low UPDRS improvement rates.

