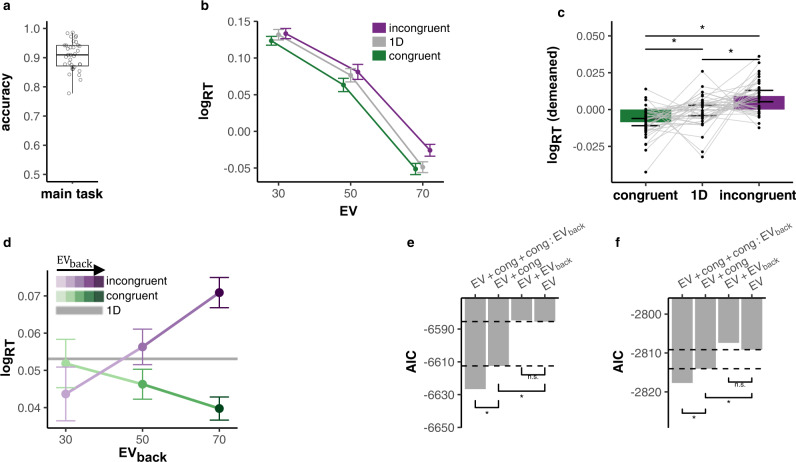
Fig. 2. Behavioral results.
a Participants performed near-ceiling throughout the main task, μ = 0.905, σ = 0.05 (n = 35). Box covers interquartile range (IQR), mid-line reflects mean, whiskers the range of the data (until ±1.5*IQR), and solid points represent outliers beyond whiskers. b Participants reacted faster to higher Expected Values (EV, x-axis) and slower to incongruent (purple) compared to congruent (green) trials. RTs for 1D trials shown in gray. Error bars represent corrected within subject SEMs102,103. c Comparison of log RTs by trial condition. Incongruent trials were slower than 1D trials (paired t-test: p = 0.013), and 1D trials slower than congruent trials (paired t-test: p = 0.017; paired t-test congruent vs. incongruent: p < 0.001). Error bars represent corrected within subject SEMs102,103. p values FDR-corrected, n = 35. d The Congruency effect was modulated by EVback, i.e., the more participants could expect to receive from the ignored context, the slower they were when the contexts disagreed and respectively faster when contexts agreed (x-axis, shades of colors). Likelihood-ratio test (LRR) to asses improved model fit: p < 0.001, n = 35. Gray horizontal line depicts the average RT for 1D trials across subjects and EV. Error bars as above. e Hierarchical comparison of 2D trial log-RT models showed that inclusion of a Congruency main effect (p < 0.001, see c), yet not EVback (p = 0.27), improved model fit. However, including an additional Congruency × EVback interaction improved model fit even more (p < 0.001, see d). p values from LR tests as above, stars indicate p < 0.05, n = 35. f We replicated the behavioral results in an independent sample of 21 participants outside the MRI scanner. Including Congruency (p = 0.009) but not EVback (p = 0.63), improved model fit. Including an additional Congruency × EVback interaction explained the data best (p = 0.017). p values/stars as in (e). Source data are provided as a Source Data file.

