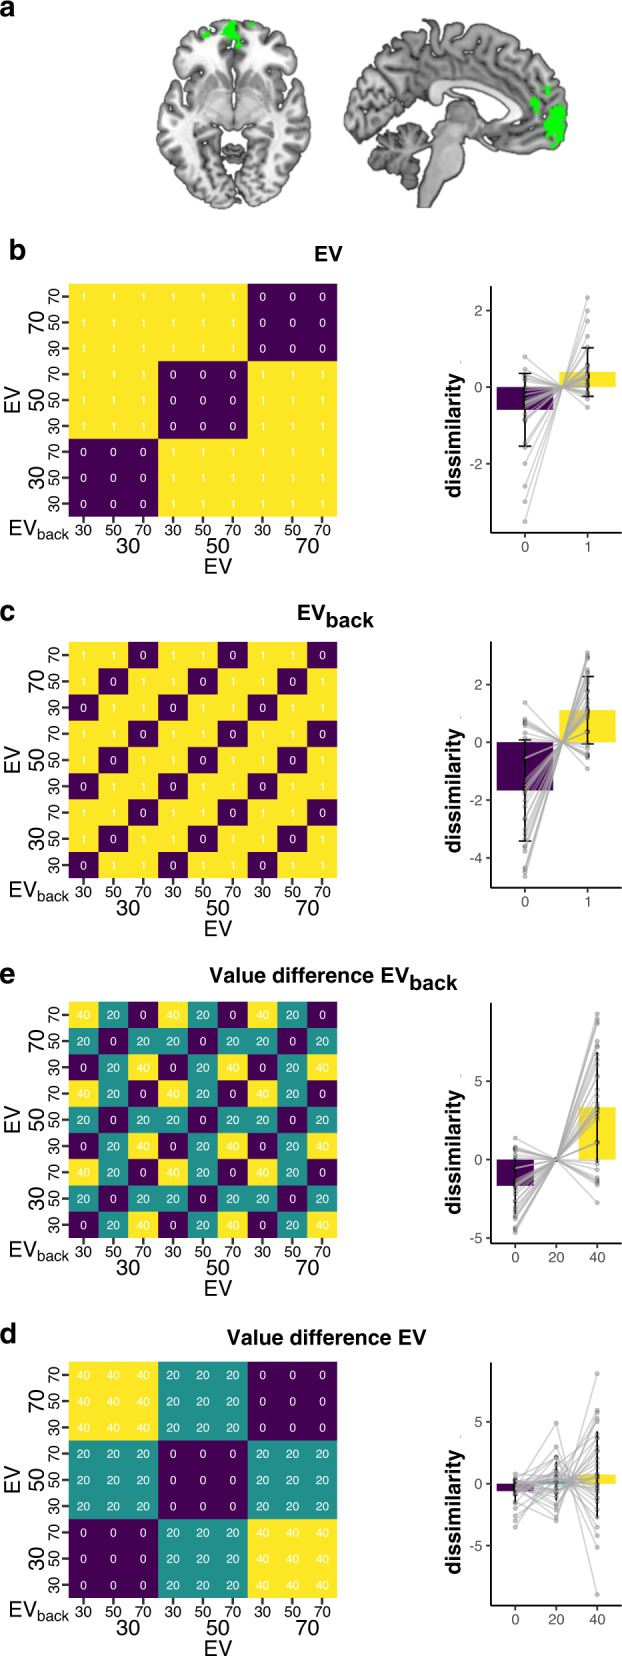
Fig. 3. RSA analyses show that vmPFC encodes both relevant as well as irrelevant expected values given the current task context.

a vmPFC region used in all analyses (green voxels), defined functionally as the positive effect of a univariate value regressor thresholded at pFDR < 0.0005 (one sided t-test, see “Methods”). Note that no information regarding the contextually irrelevant values was used to construct the ROI. Axial slice (left) at x = −6; Sagittal slice (right) at z = −6. b Left: Model RDM, each cell represents one combination of EV and EVback, see axes. Colors reflect whether a combination of trials had the same EV (purple) or not (yellow). Right: Dissimilarity of vmPFC activation patterns for trials with the same vs. different EV. Dissimilarity was lower in trials that share the same expected value (EV, p < 0.001, n = 35). c Model RDM (left) testing whether irrelevant expected value (EVback) affected similarity in vmPFC. We found less dissimilarity for trails with the same EVback (p < 0.001, n = 35, right). d Left: Model RDM that tested whether patterns similarity was influenced by the size of EV differences (0: purple, 20: turquoise, 40: yellow). Right: Average dissimilarity associated with the varying levels of value difference, indicating that larger EV differences between trials were related to higher pattern dissimilarity (p < 0.001, n = 35). e The same effect was found with respect to EVback where patterns that share the same EVback (irrespective to EV) also showed a decrease in dissimilarity (p < 0.001, n = 35). Data shown in bar plots are demeaned by trial-frequency in the design to match the mixed effect models (see “Methods” and Fig. S6). Error bars in (b)–(e) represent corrected within-subject SEMs102,103. p values in (b)–(e) reflect likelihood-ratio test of improved model fit, see main text. Source data are provided as a Source Data file.
