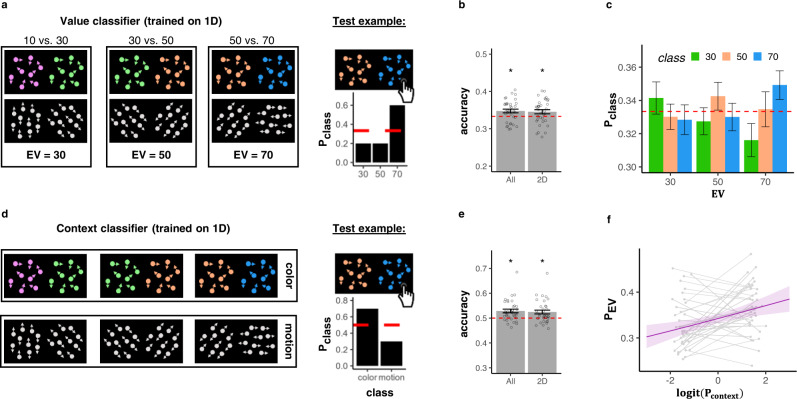
Fig. 4. Expected value and context signals co-reside within vmPFC.
a A logistic classifier was trained on behaviorally accurate 1D trials to predict the true EV from vmPFC patterns (“Value classifier”, left). We analyzed classifier correctness and predicted probability distribution (right). shown in (b) and (c). b The Value classifier assigned the highest probability to the correct class (objective EV) significantly more often than chance for all trials (p = 0.003, n = 35), also when tested on generalizing to 2D trials alone (p = 0.017, n = 35). c The probabilities the classifier assigned to each class (y-axis, colors indicate the different classes, see legend) split by the objective EV of the trials (x-axis). As can be seen, the highest probability was assigned to the class corresponding to the objective EV of the trial (i.e., when the color label matched the X axis label). n = 35, for individual data points see Fig. S7. d A second logistic classifier was trained on the same data to distinguish between task contexts (color vs. motion), irrespective of the EV (“Context” classifier). e The Context classifier assigned the highest probability to the correct class (objective Context) significantly more often than chance for all trials (p < 0.001, n = 35), also when tested on generalizing to 2D trials alone (p = 0.001, n = 35). f Increased evidence for the objective EV (PEV, y-axis) was associated with stronger context signal in the same ROI (x-axis, where probabilities z-scored and logit-transformed, LR-test compared to null model: p = 0.002, N = 35). Plotted are model predictions and gray lines represent individual participants (mean of the top/bottom 20% of trials). Error bands represent the 89% confidence interval. p values in (b) and (e) reflect one sided t-test against chance. Error bars in (b), (c) and (e) represent corrected within-subject SEMs102,103. Source data are provided as a Source Data file.

