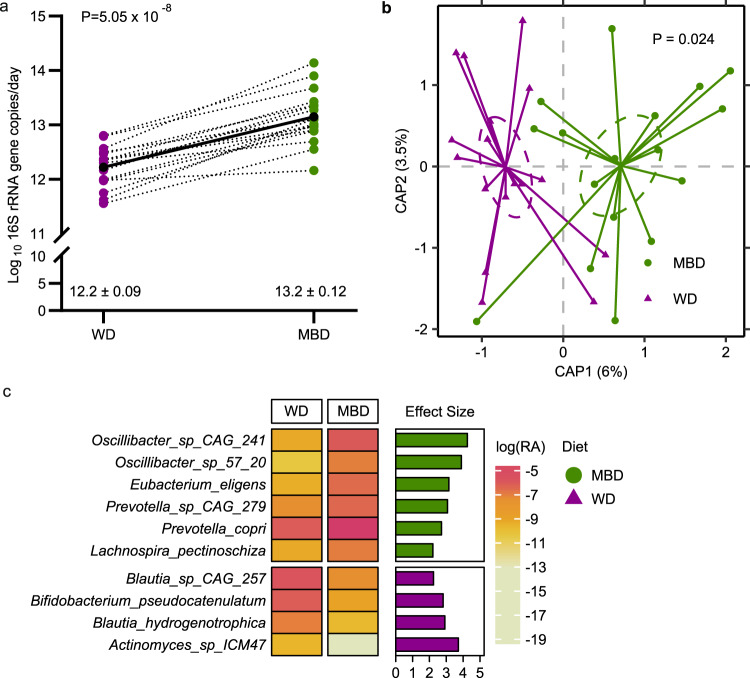
Fig. 2. Diet modulated the gut microbiome.
a Fecal bacterial 16S rRNA gene copy number (a surrogate of biomass); P value is from linear mixed effects regression model and denotes a statistically significant effect of diet on 16S rRNA gene copy number. b Beta-diversity (Bray–Curtis Dissimilarity). P value is from PERMANOVA test and denotes a statistically significant effect of diet on Bray–Curtis Dissimilarity metric. c Heatmap showing the natural-log-transformed mean relative abundance of species whose relative abundance was significantly different by diet (based on MaAsLin2); bar plot shows the effect size of the regression coefficient from compound Poisson regression models comparing the relative abundance of each species by diet. Species shown in this figure were significantly different by diet (P values were corrected to produce Q values using the Benjamini–Hochberg method; Q < 0.05), and the diet difference had an effect size ≥2. n = 17 per diet for all panels. Source data are provided as a Source Data file. CAP Canonical Analysis of Principal Coordinates, MBD Microbiome Enhancer Diet (green), WD Western Diet (purple).

